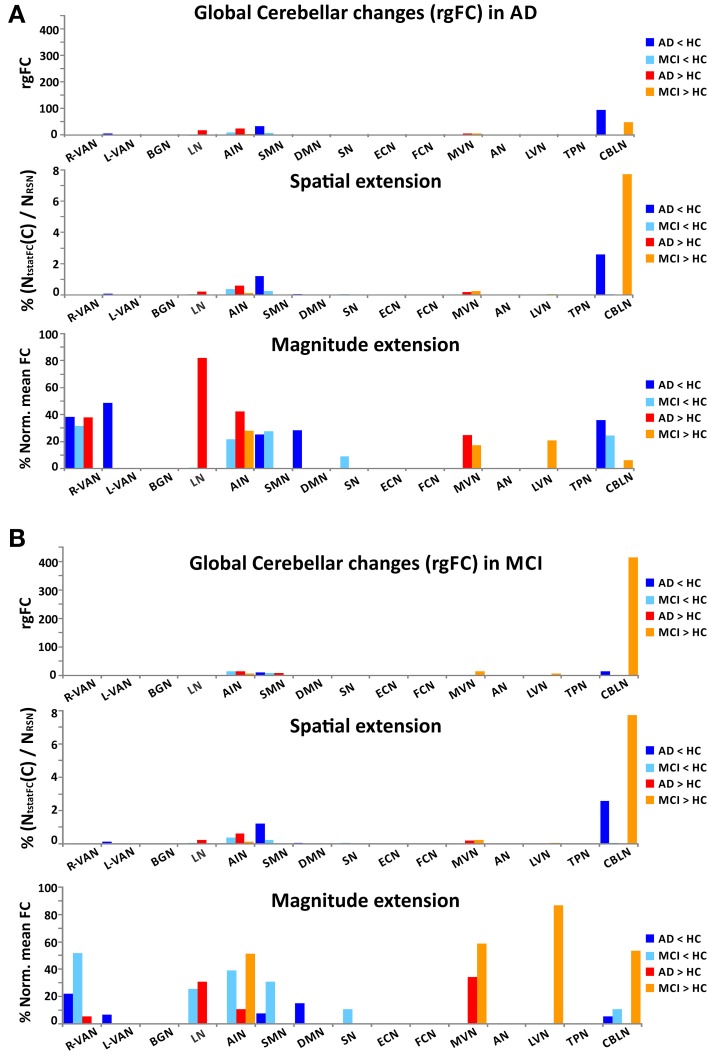
Figure 6.
Global cerebellar alterations in AD and MCI. For each RSNs and for each contrast (AD < HC, AD > HC, MCI < HC, and MCI > HC), the histograms show the global changes occurring in the cerebellum C(rgFC) in AD (A) and in MCI (B). For each RSN, the set of histograms shows: (1) the global changes of the rgFC index in the cerebellum (C), (2) the contribution to the rgFC in the cerebellum given by the spatial extension of the clusters of functional alteration (NtstatFC/NRSN), (3) the contribution of the magnitude extension of the cerebellar functional alteration [meanFC(C)Pwith p = MCI or AD, normalized for the to the meanFC(C)HC].

