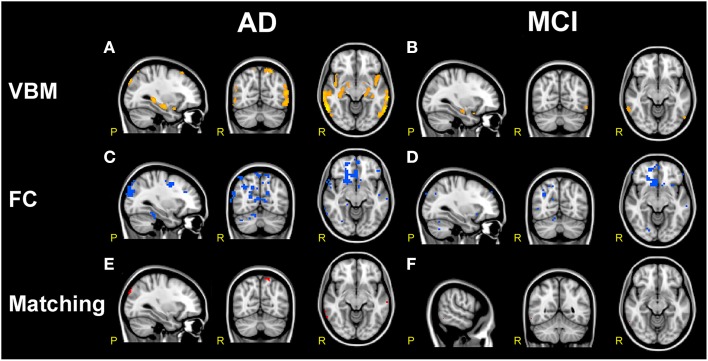
Figure 7.
Comparison of structural and functional changes in AD and MCI. (A,B) VBM analysis. AD subjects compared to HC (A) show large areas of GM atrophy (orange) in bilateral mesial-temporal network. MCI subjects compared to HC (B) show sparse areas of GM atrophy (orange) in left and right hippocampus, left amygdala, parahippocampal gyrus, precuneus and superior temporal gyrus. AD show more extended areas of atrophy than MCI. (C,D) FC analysis. Both AD and MCI compared to HC show large clusters of FC reductions (blue) mainly localized in the prefrontal areas involving VAN, DMN, DAN, FCN, SN, and SMN, with more extended areas of FC reductions in AD than MCI. (E,F) VBM/FC matching. Matching VBM and FC maps of FC reduction for AD compared to HC and MCI compared to HC. The overlapping between atrophy and FC changes (red clusters) is very limited.

