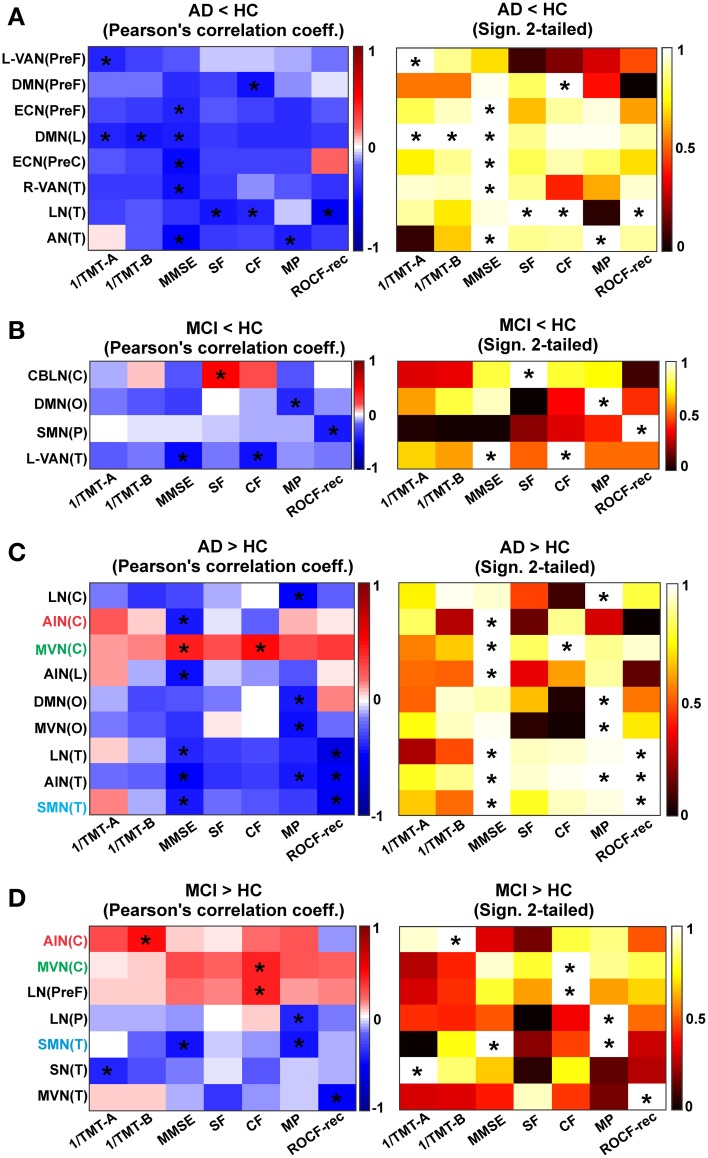
Figure 8.
Correlation between rgFC changes and clinical and neuropsychological tests. Results are reported for each contrast (A) AD < HC, (B) MCI < HC, (C) AD > HC and (D) MCI > HC. Correlation matrixes (left) and the corresponding statistical significance of correlations (right) between clinical and neuropsychological tests (1/TMT-A, 1/TMT-B, MMSE, MP, CF, SF, ROCF-copy, and ROCF-rec) and rgFC areas: cerebellum (C), prefrontal (PreF), limbic (L), occipital (O), parietal (P), precentral (PreC), and temporal (T). Correlation and anti-correlation are reported on different color scales. Correlations that satisfied a statistical threshold of p < 0.01 are marked with a star (*). The statistical significance (matrices on the right) of each Pearson's correlation coefficient (matrices on the left, with the positive correlations in red scale and the negative ones on blue scale) is represented as 1–p-value.

