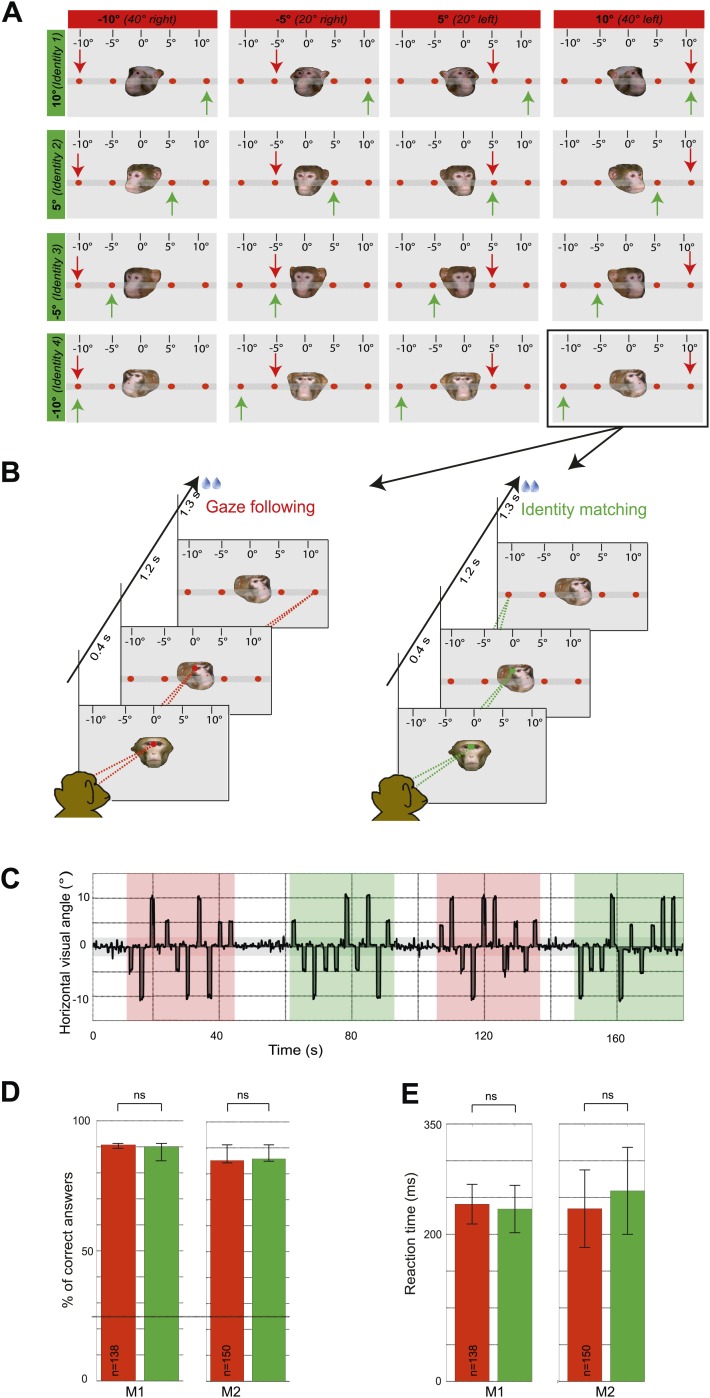
Figure 1. Experimental paradigm and behavioral results (‘gaze following’ paradigm).
(A) Stimuli. 16 portraits used in the gaze following and identity matching tasks, arranged by the same identity (rows) or head orientations (columns, demonstrator's head orientation eccentricity indicated in brackets). The arrows point to the correct target dot in gaze following (red) and identity matching task (green). Arrows and the scale with the eccentricity of the target as seen by the observer were not visible during the experiment. Portraits and target bar were presented on an otherwise black background (here shown as gray for better visualization). (B) Sequence of events. Exemplary gaze following (left) and identity matching (right) trials. (C) Exemplary horizontal eye movements sampled during a typical fMRI run. The gray shaded horizontal area around 0° indicates the limits (±2°) of the fixation window, the red areas indicate gaze following blocks and the green ones identity matching blocks. White areas outline the 'fixation-only' blocks. (D) Median percentages of correct answers in gaze following (red) and identity matching blocks (green), pooled separately for each observer (M1: 138 blocks; M2: 150 blocks) in ‘gaze following’ paradigm. Error bars represent 95% confidence intervals. The difference was not significant (ns, Wilcoxon signed rank test: p=0.67 [M1], p=0.43 [M2]). Dashed line indicates the chance level in each task (25%). (E) Mean reaction times in gaze following (red) and identity matching blocks (green), pooled separately for the two observers (M1:138 blocks; M2: 150 blocks) in ‘gaze following’ paradigm. Error bars represent standard errors. The difference was not significant (ns, paired samples t test: p=0.08 [M1]; p=0.22 [M2]).

