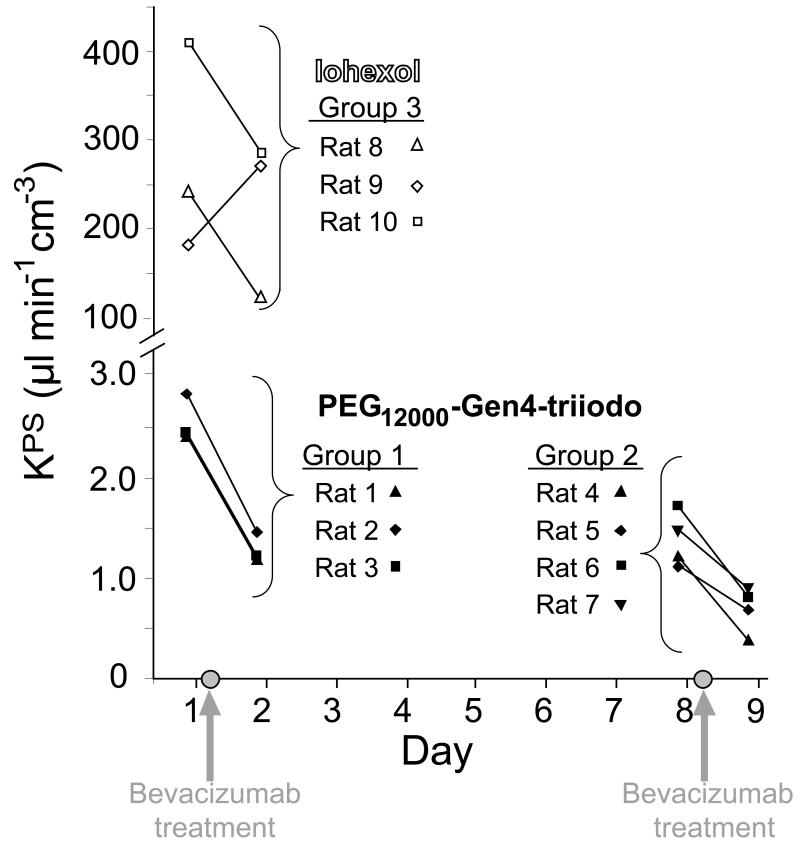
Figure 4.
Graph of KPS as determined by dynamic contrast-enhanced CT scans for the macromolecular PEG12000-Gen4-triiodo contrast agent and the low-molecular-weight contrast agent Iohexol. Gray circles on the x-axis indicate the time of intraperitoneal injection of bevacizumab, an antiangiogenesis drug, which was given immediately following the day 1 and day 8 CT scans. A significant reduction in KPS was seen between the pre- and post-treatment CT scans for the macromolecular contrast agent for both the first dose (Group 1, mean, 2.56 versus 1.28 μl min−1 cm−3 on day 1 versus 2, respectively, p < 0.005) and second dose (Group 2, mean, 1.40 versus 0. 69 μl min−1 cm−3 on day 8 versus 9, respectively, p < 0.005). Similarly, the KPS remained significantly lower on day 8 than prior to the first dose of angiogenesis inhibitor drug (p<0.005), and was not significantly different between day 2 and day 8 (p = 0.50). No significant difference was seen for the KPS between the pre- and post-treatment CT scans for iohexol (Group 3, mean, 276.0 versus 223.8 μl min−1 cm−3 on day 1 versus 2, respectively, p=0.54)

