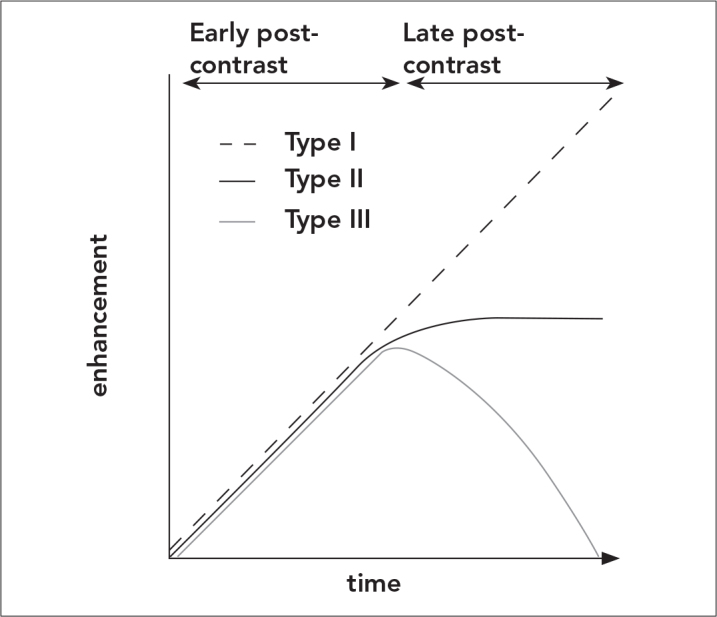
Figure 6.

Time-enhancement curves show signal intensity changes formed in the tissue by time as a reflection of enhancement. Kinetic curves are evaluated for increase of signal in two stages: In the early stage after bolus injection (first 2–3 minutes) and in the late stage. In the early stage, the rate of signal increase can be slow, moderate and fast. In the late stage, the intensity can continue to increase (persistent type, type 1- benign type) it can stay at the same level (plateau type, type 2- doubtful type) or it can decrease (wash-out type, type 3- malignant type)
