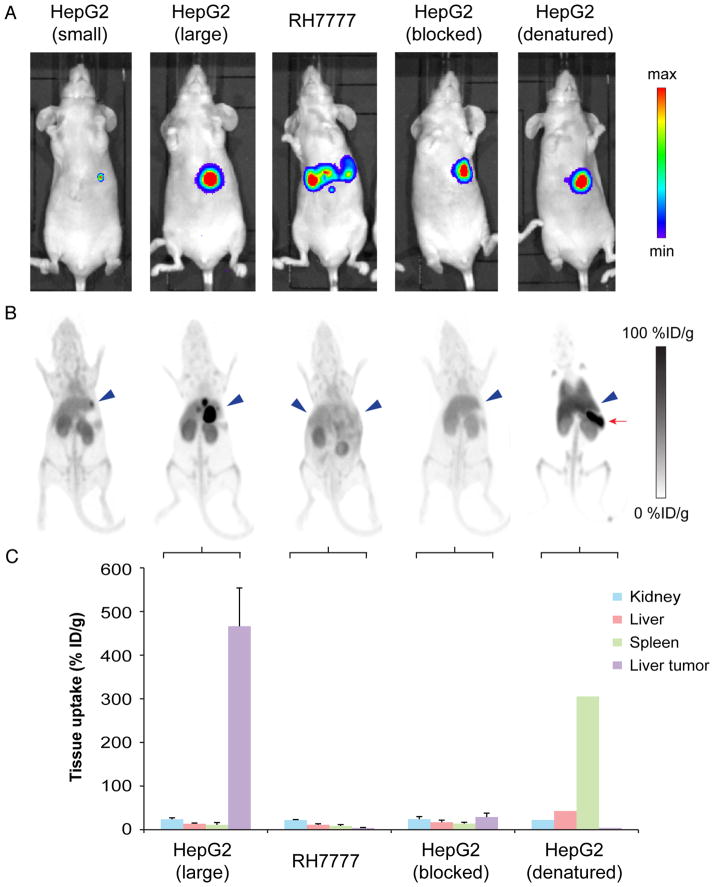
FIGURE 4.
(A) IVIS luminescent images before administration of 89Zr-αGPC3. (B) Selected small-animal PET images of same animals showing tumor concordance in HepG2 tumor-bearing animals and lack of tumor uptake in RH7777, blocked, and heat-denatured controls. Signal saturation was permitted to enable comparisons between animals. Blue arrowheads indicate tumor location; red arrow indicates spleen. (C) Day 7 decay-corrected biodistribution of 89Zr-αGPC3 confirming low liver tumor uptake in RH7777, blocked, and heat-denatured controls.

