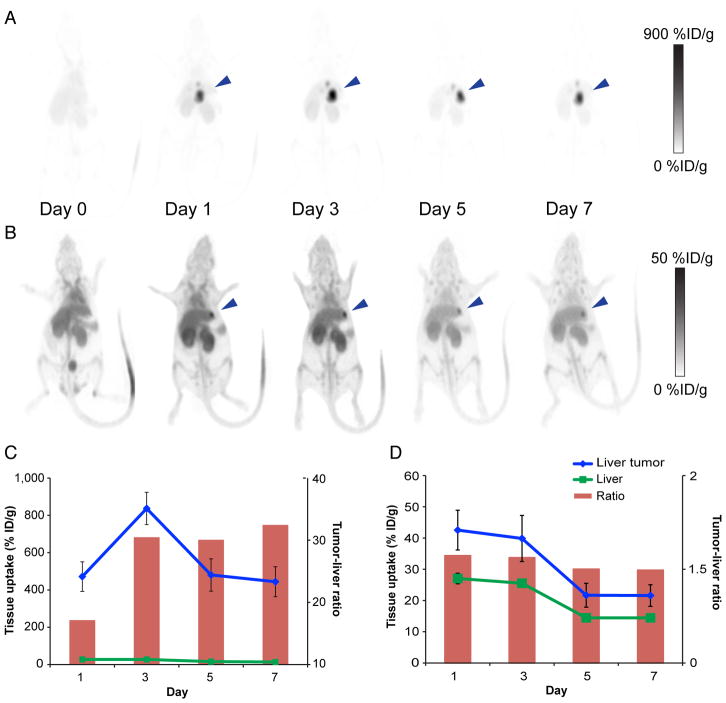
FIGURE 5.
(A and B) Serial decay-corrected whole-body small-animal PET images of mouse bearing large HepG2 tumor (3.8 mm) (A) and small HepG2 tumor (<1 mm) (B). Blue arrowhead indicates tumor location. (C and D) Average tumor and liver activity obtained from small-animal PET data for mouse with large HepG2 tumor (C) and mouse with small HepG2 tumor (D).

