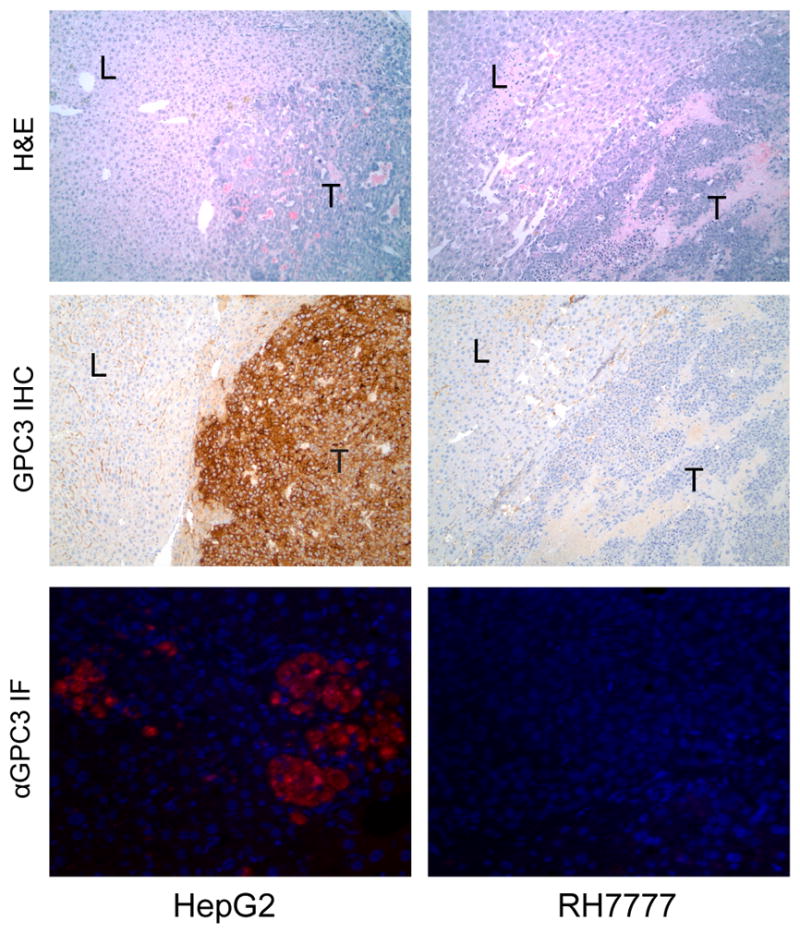
FIGURE 6.

Histologic sections of PET-imaged mouse liver (L) and liver tumor (T) stained with hematoxylin and eosin (top row) and immunohistochemistry against GPC3 (middle row) viewed at ×100 magnification. Immunohistochemistry confirms polymerase chain reaction data showing high expression in HepG2 and minimal expression in RH7777 tumors. Bottom row demonstrates immunofluorescence of goat antimouse secondary antibody binding against mouse antihuman αGPC3 in HepG2 and RH7777 tumors.
