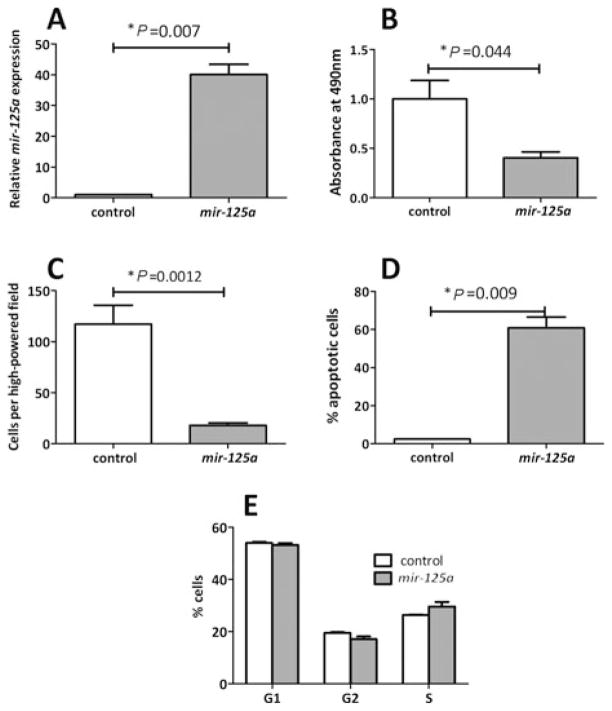
FIGURE 2.
Proliferation of IEC-6 cells overexpressing either mir-125a or a nonsilencing control RNA (control). A, Mir-125a expression was analyzed by RT-PCR. B, Proliferation index was determined using the MTS assay. C, Cell numbers were assessed by counting cell densities. Apoptosis (D) and cell cycle progression (E) were assessed by fluorescence-activated cell sorting using Annexin V or Sytox Blue, respectively.

