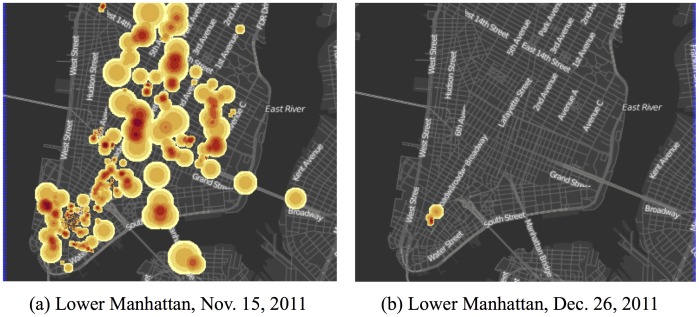
Figure 1. Heatmap of geotagged Twitter activity.
Twitter activity related to the Occupy Wall-Street (OWS) Movement, collected for hashtags, or topics, used by protests or members of the movement. The “redder” areas indicate regions with more tweets. Here we see two extremes of geotagging behavior. Panel (a) shows the tweets for 15 November 2011, when the New York Police Department attempted to remove protesters from Zuccotti Park. Panel (b) shows the tweets for 26 December 2011, when protesting had dwindled. In between these two extremes of activity, is a more general pattern of discussion centered around the protests in Zuccotti Park.

