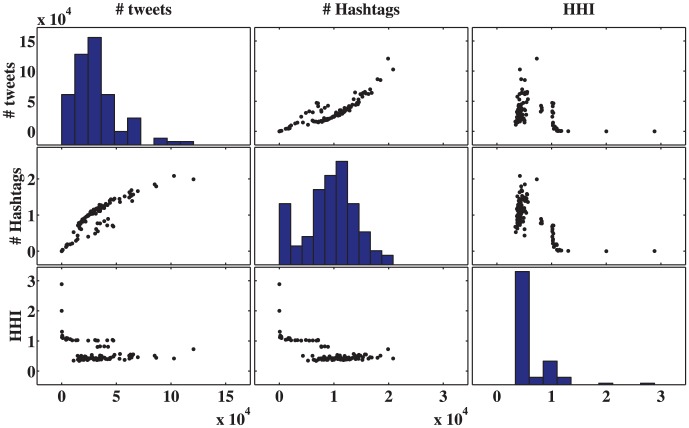
Figure 3. Comparison of the HHI to its underlying parameters: the number of tweets, and number of hashtags.
Here, the diagonal figures represent the histogram of values for each of these three parameters, whereas the off diagonal panels represent a comparison of the values of two different parameters. It is clear by studying these figures that the HHI is not merely a function of either the number of tweets or number of users.

