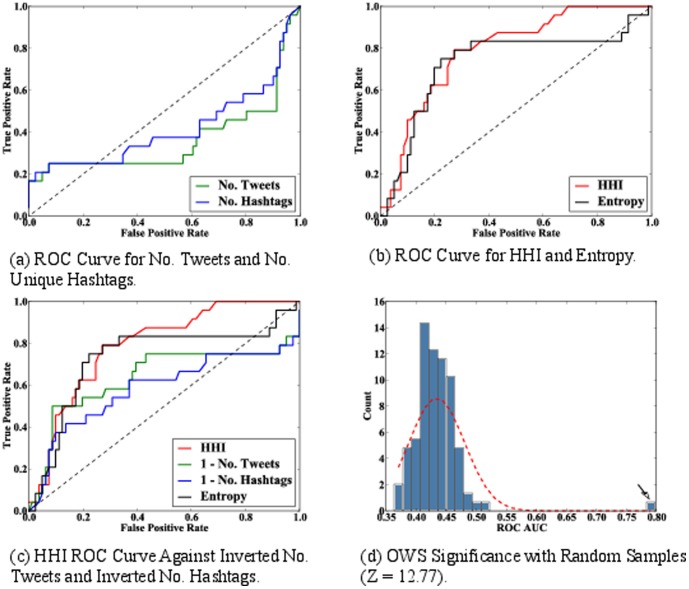
Figure 4. HHI ROC analysis.
(a) ROC curve of number tweets and number unique hashtags as classifiers for finding significant dates in the dataset. Number of tweets AUC = 0.42 and number of unique hashtags AUC = 0.36. (b) ROC curve of the HHI and Entropy classifiers. HHI AUC = 0.79, entropy AUC = 0.72. The focus-based classifiers provide the best classification when compared with the other methods, with the HHI being the best predictor. (c) ROC curve of the four classifiers - one minus number of tweets, one minus number of hashtags, and hashtag entropy - and their performance in identifying the ground truth. This is done as a below-random (<0.50) AUC means that the class labels should be inverted. (d) Distribution of the HHI AUC values for prediction of the ground truth for many random samples of the OWS dataset. The arrow in this figure represents the measure of the unshuffled data.

