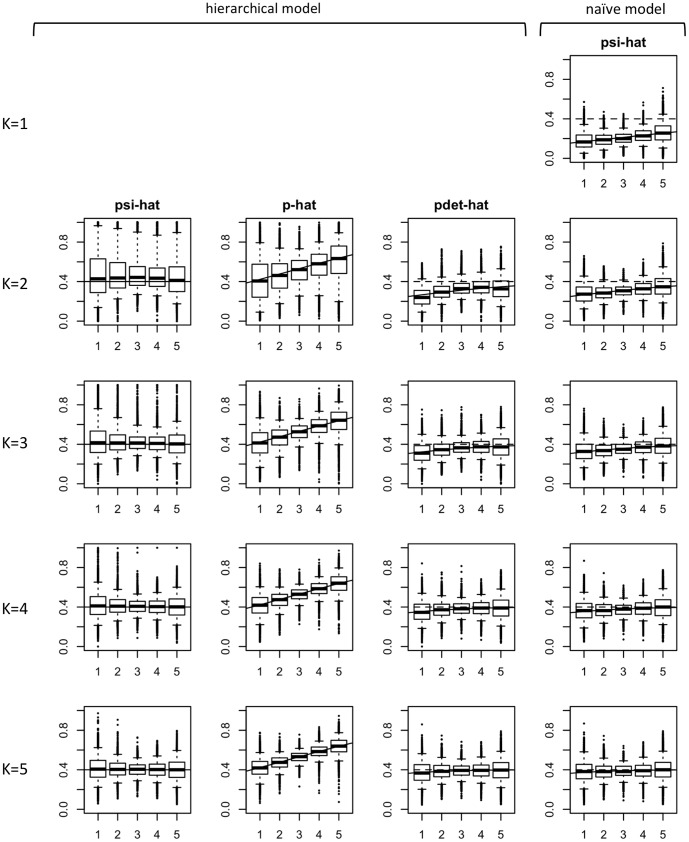
Figure 2. Simulation results of fitting hierarchical and naïve occupancy models to 5000 data sets from Scenario A1 with 55 sites.
The first three columns correspond to the hierarchical model: in column 1 estimates of occupancy probability  (‘psi-hat’), in column 2 estimates of the conditional single-survey detection probability
  (‘p-hat’) and in column 3 estimates of the unconditional detection probability after K surveys
  (‘pdet-hat’). Column 4 presents the estimates for the naïve model that assumes perfect detection. Rows represent increasing number of replicate surveys per site, from K = 1 to K = 5. Where
  the naïve model was fitted to data collapsed to a single record per site (1 if species detected at least once, 0 otherwise). In this particular scenario (also presented by [14]) the imprecision in the hierarchical model is large compared to the bias in the naïve model. The true occupancy was 0.4, and the true detection probability increased with the value of the x-variable. In each figure a solid line represents true values. For reference, in columns 3 and 4 a dashed line represents the true occupancy probability.

