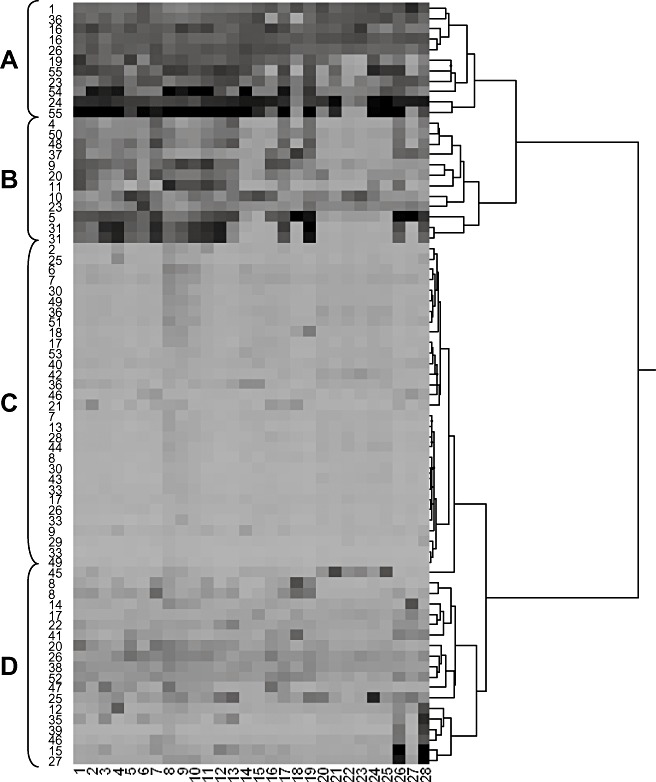
Figure 2.

Hierarchical clustering of backbone enzymes. The cluster numbers of each backbone enzyme are given on the left. Experiments 1–28 (Table 1) are listed along the bottom. Shading represents the intensity of gene expression, with darker shading indicating higher expression. Letters A–D represent the four clades discussed in more detail in the text.
