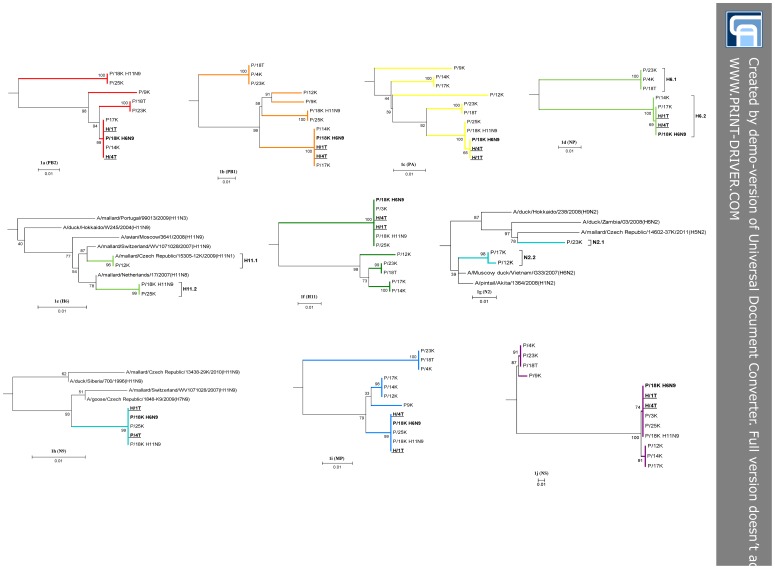
Figure 1. Phylogenetic trees of the locality P and H avian influenza viruses.
Trees were generated with maximum-likelihood method in the MEGA 6.0 software on the basis of nucleotides 1251–2288 (1038) of PB2, 1465–2289 (825) of PB1, 783–1401 (649) of PA, 816–1724 (909) of H6, 679–1274 (596) of H11, 748–1544 (797) of NP, 568–889 (322) of N2, 1050–1431 (382) of N9, 203–1006 (804) of MP, and 540–870 (331) of NS. The nucleotide substitution models implemented were listed in the Materials and methods section. Bootstrap values (1000 re-samplings) in percentages are indicated at each node. The locality P H6N9 strain (P/18K_H6N9) was highlighted in bold and the locality H H6N9 strains (H/1T and H4/T) are bold and underlined. Each particular tree was supplemented with a nucleotide sequence identity matrix table (Tables S3a–j in File S1). The sub-clades of interest were highlighted with a segment specific color which is corresponding to Figure 2 and the abbreviations used with Table 1 respectively.

