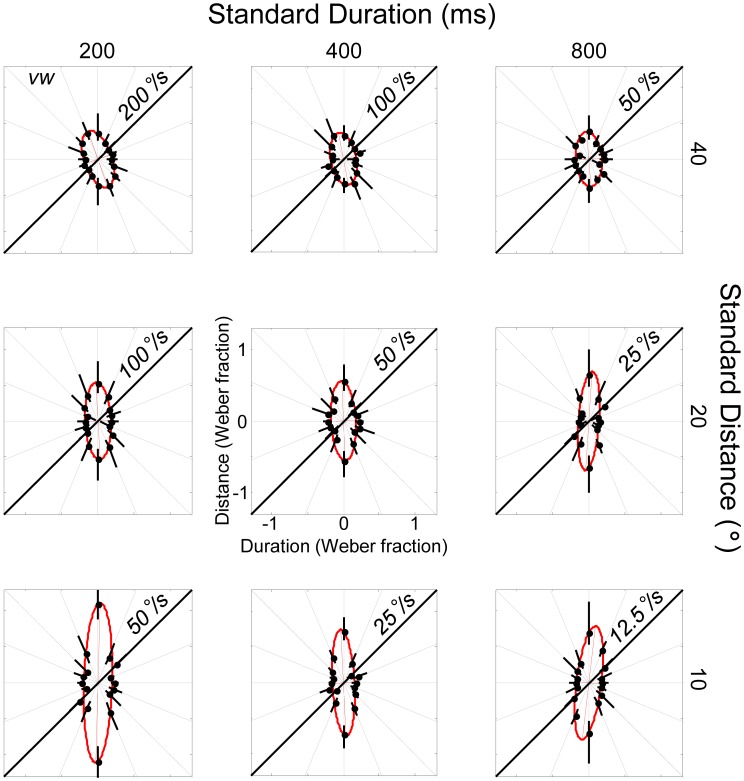
Figure 3. Motion discrimination contours for a single naïve observer for the 9 standards investigated in Experiment 1.
The results for each individual standard value follow the conventions defined in Figure 1. Error bars for each threshold were obtained using a bootstrapping technique and correspond to 95% CIs. Ellipses were fit according to a non-linear least-squares technique.

