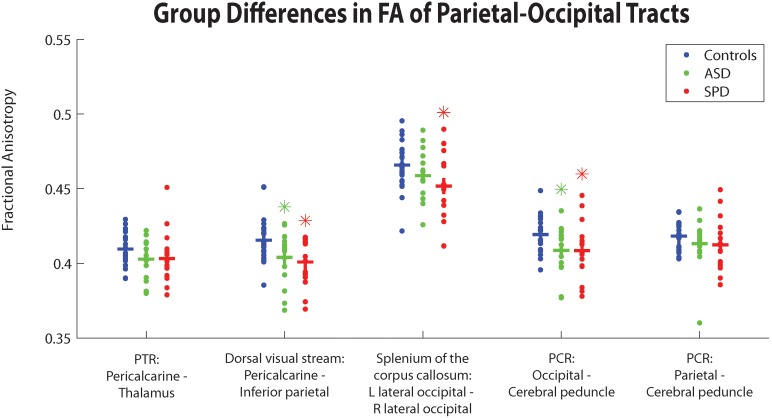
Figure 3. Group differences between TDC, SPD, and ASD subjects in average FA within different parietal-occipital tracts.
Crossbars correspond to group averages. Green asterisks depict significant group differences between ASD and TDC subjects, and red asterisks depict significant group differences between SPD and TDC subjects, FDR corrected at p<0.05.

