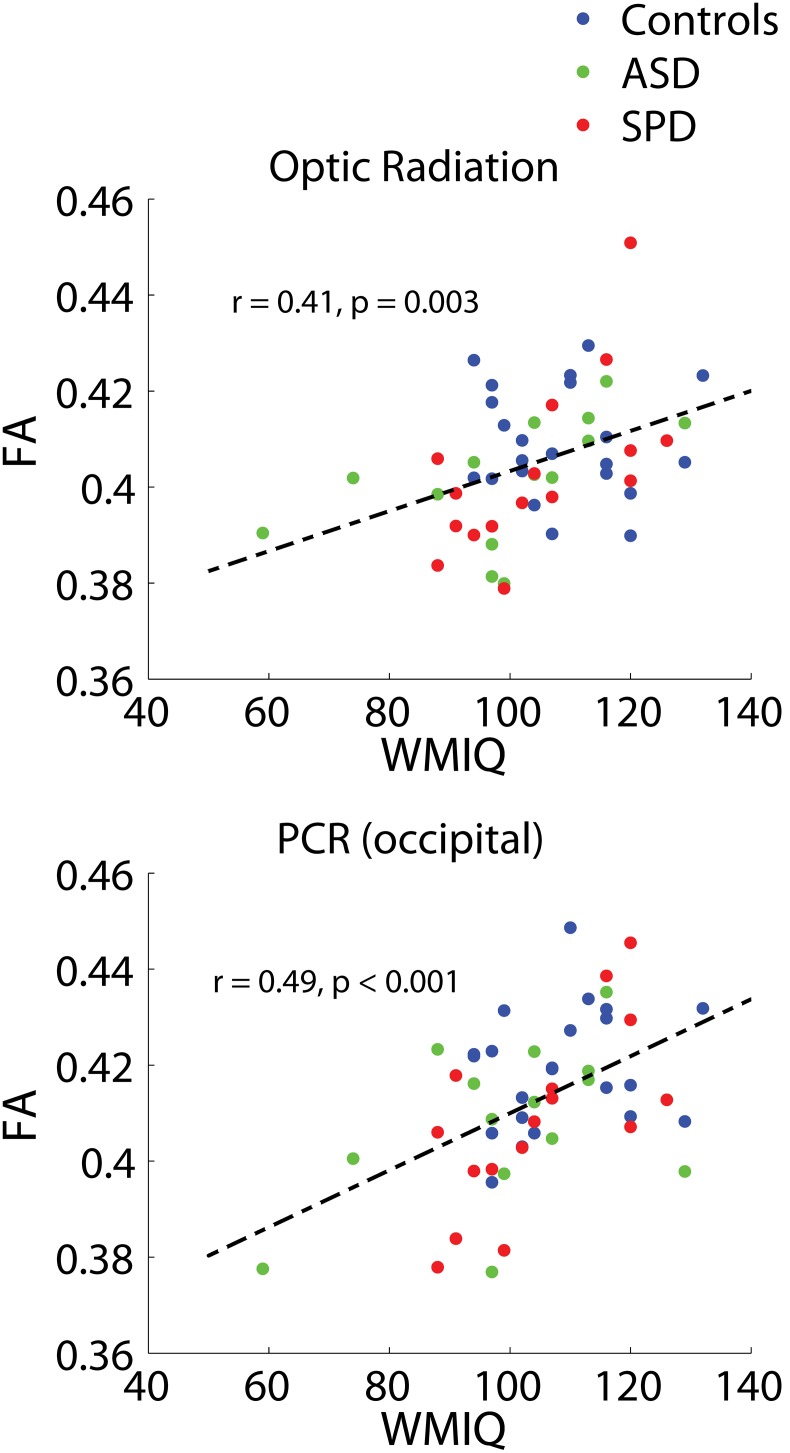
Figure 5. Combined-group associations between tract connectivity and WMI.
The two bilateral tracts demonstrating significant associations between FA and WMI after FDR correction are displayed. Optic radiation: r = 0.41, p = 0.003. PCR (occipital): r = 0.49, p<0.001. Results of unilateral and individual group correlations are displayed in Table 7.

