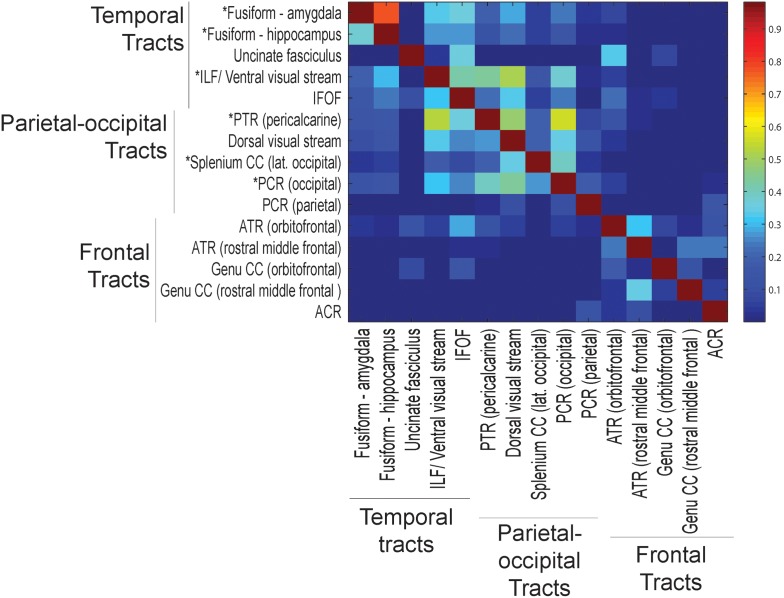
Figure 9. Average fraction of tract overlap.
Color intensity corresponds to the subject average of the fraction of the voxels of the tracts on the vertical axis that are contained within the tracts on the horizontal axis. Tracts that are more than one-third contained in any other tract are indicated by an asterisk on the vertical axis.

