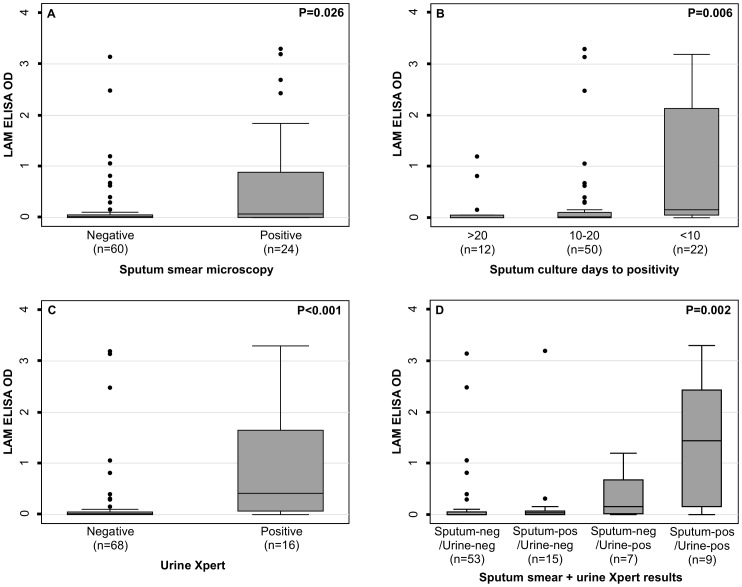
Figure 2. Box and whisker plot of urine concentrations of lipoarabinomannan (LAM) expressed as ELISA optical densities in patients with HIV-associated tuberculosis stratified by indices of mycobacterial burden: a) sputum smear microscopy result (n = 84), b) sputum culture days to positivity (n = 84), c) urine Xpert result (n = 84), d) a composite index combining sputum smear microscopy and urine Xpert results (pos = positive; neg = negative).
Bars, box and whiskers indicate medians, 25th and 75th centiles and ranges, respectively. P-values are either Wilcoxon rank-sum tests or Kruskal-Wallis for comparison of medians.

