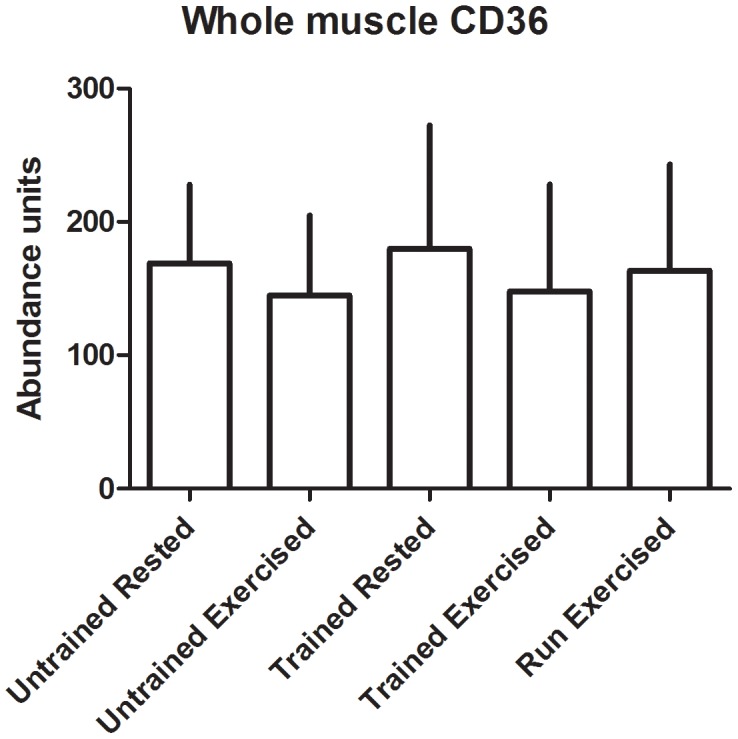
Figure 4. FAT/CD36 abundance in whole muscle homogenates.

Transporter was quantified using Western blot, and abundance is expressed as arbitrary optical density units. Data displayed as mean and standard deviation. Untrained Rested n = 5, Untrained Exercised n = 8, Trained Rested n = 8, Trained Exercised n = 8, Run Exercised n = 7.
