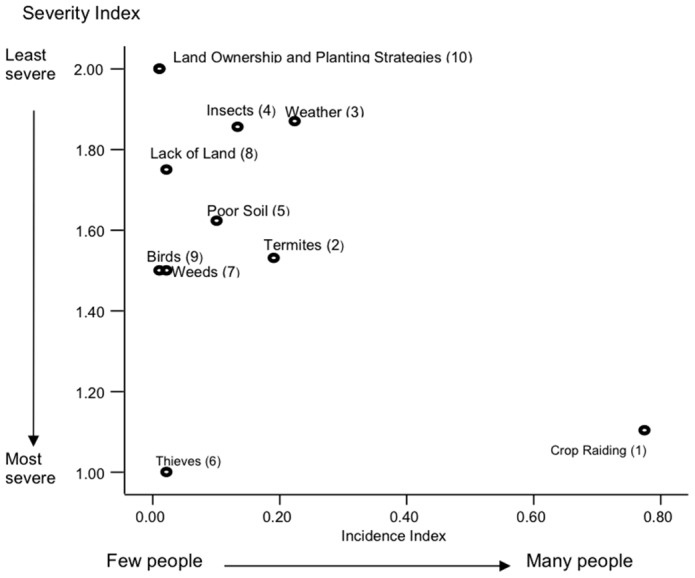
Figure 2. Risk map overview depicting farmers' perceptions of crop damage by animals proportional to other risks to agricultural production (159 responses).

Severity is measured from 1 (most severe) to 2 (least severe). Risk index rank is in parenthesis.
