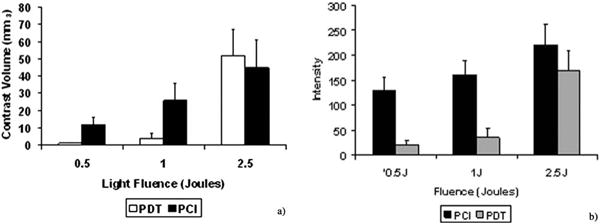
Figure 9.

(a) Average contrast volume and (b) signal intensity measured from MR images performed 3 days post-PDT or ETXp-PCI treatment for three light fluences (fluence rate = 10 mW). Each data point represents the mean (± standard error) of four animals [20]. (Reprinted with permission.)
