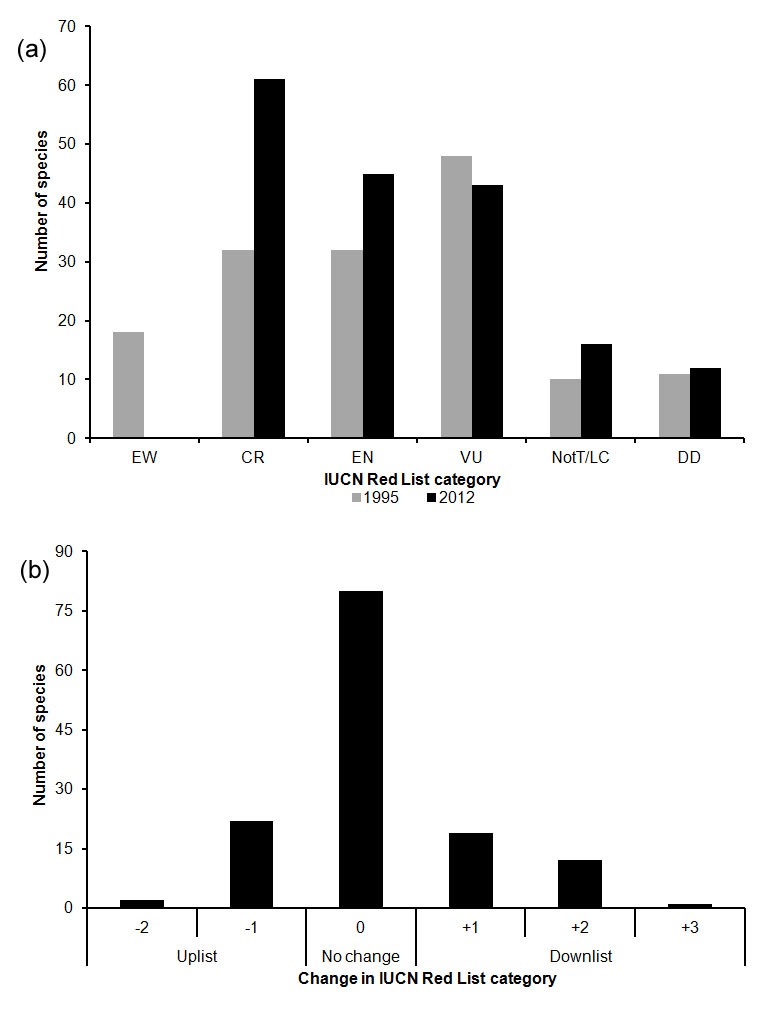
Figure 3. Comparison between the palm assessment of 1995 and 2012.

IUCN Red List categories: Extinct in the Wild (EW), Critically Endangered (CR), Endangered (EN), Vulnerable (VU), Least Concern (LC), Data Deficient (DD) [31]. (a) Number of species assessed in each category (total assessments: 164 in 1995, 192 in 2012). All species assessed in each year are illustrated (see Table 3), except for those placed in categories that are not comparable (13 species assessed as “Rare” in 1995 [10] and 14 species assessed as NT in 2012 [44]; see methods). (b) Change in IUCN Red List status (see Table 3) where positive values indicate downlisting to lower extinction risk (e.g. CR to EN is a downlisting of 1 step) and negative values indicate uplisting to higher extinction risk (e.g. EN to CR is an uplisting of 1 step). Figure 3b includes 130 data sufficient species (i.e. excluding species rated as DD in either year) that were assessed in comparable categories in both 1995 [10] and 2012 [44].
