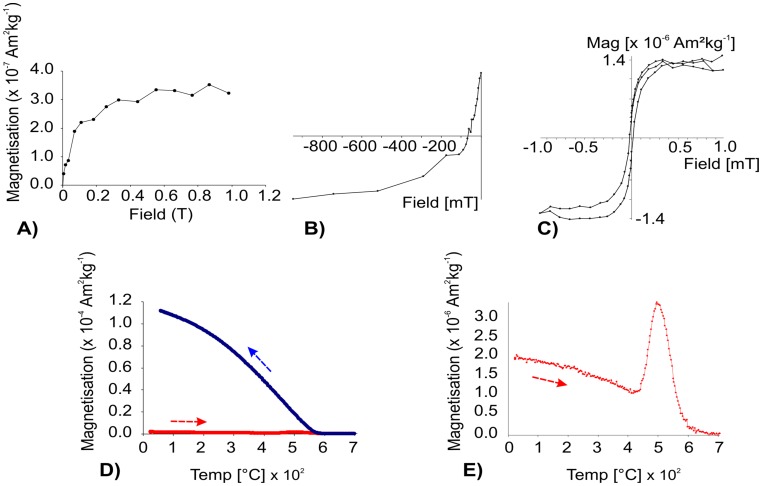
Figure 4. Rock magnetic experiments conducted on a representative sample (P2-9), corresponding to Zijdervelt diagrams of the Figure 3A and B.
A) Progressive isothermal remanent magnetization (IRM) acquisition curve. B) Back-field curve. C) Hysteresis loop (±1 T). D) Thermomagnetic curve; arrows indicate heating and cooling cycles. E) Heating cycle of the Figure 4 D was amplified.

