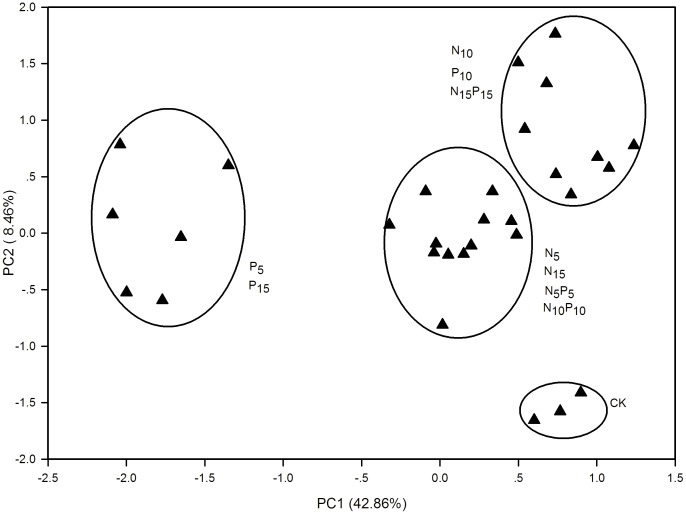
Figure 7. Principal component analysis results according to average well color development data of carbon substrate groups at 168 h in BIOLOG Ecoplates.
N, nitrogen fertilization; P, phosphorus fertilization; CK, unfertilized control; subscript numbers 5, 10, 15 indicate corresponding fertilization rates (g m−2 yr−1).

