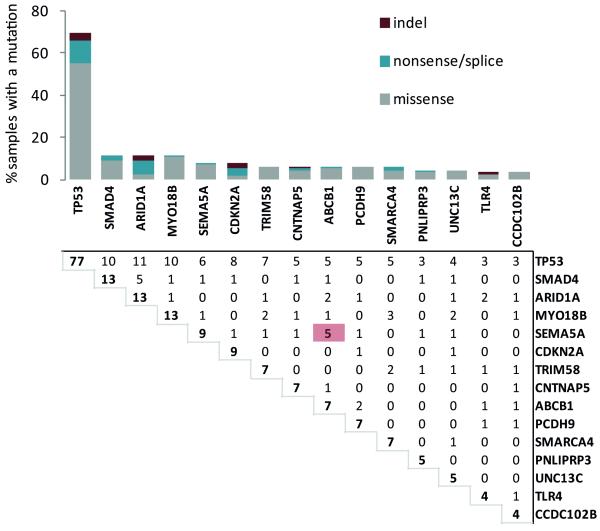
Figure 2. Mutation in esophageal adenocarcinoma.
The bar graph on the top indicates the percentage of samples with aberrations for a given gene. The number in bold denotes the total number of mutations for each gene. Genes with four or more mutations in our EAC discovery and validation cohort (combined total of 112 patients) were included. The proportion of missense, nonsense/splice and indel mutations are shown. The matrix below shows the number of samples with mutations in both genes for each possible pairing of genes. The red highlighted box indicates significantly co-occurring mutations (Significance was assessed empirically from 100,000 permutations. False discovery rate was controlled using the Benjamini-Hochberg procedure.).

