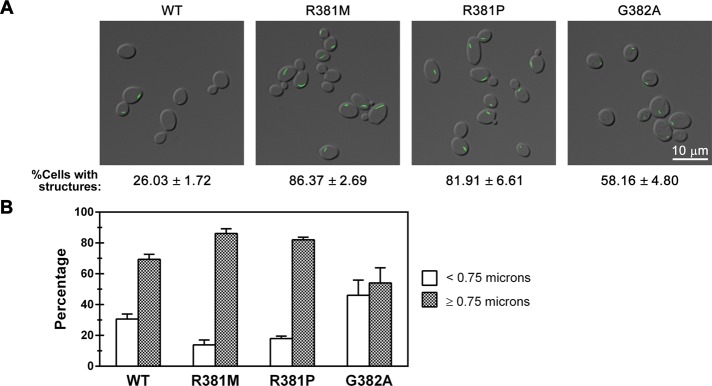
FIGURE 5.

Effect of mutations in the allosteric regulatory domain on CTP synthase structure formation. (A) Representative images of yeast strains expressing wild-type (WT) or GTP-binding-site mutant Ura7p-GFP. The average percentage and SEM of cells with Ura7p-GFP structures are indicated below individual image. (B) Percentages of foci (<0.75 μm) and filaments (>0.75 μm) for Ura7p-GFP structures are graphed for WT and each GTP-binding-site mutant for comparison.
