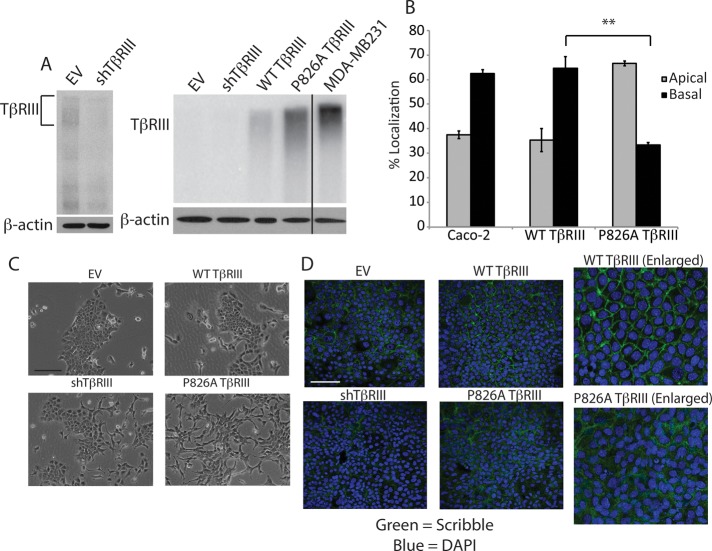
FIGURE 2.
P826A TβRIII expression results in a loss of cell polarity. (A) Left, binding and cross-linking of surface TβRIII showing a lower level of TβRIII in the stable shTβRIII cells compared with the EV cells. β-Actin Western blotting was used as a loading control. Right, binding and cross-linking, showing the relative surface levels of TβRIII in the EV and shTβRIII lines, as well as in the WT TβRIII and P826A TβRIII rescued lines. The endogenous TβRIII level in the MDA-MB-231 breast cancer cell line is shown for comparison. Note that with this lighter exposure, the EV and shTβRIII signals are not observable. (B) Caco-2 and NMuMG WT and P826A TβRIII cells were grown in Transwells for 5 d. Cells were incubated with fresh medium on the apical and basal sides for a further 24 h. Media were collected, and the level of shed TβRIII in each compartment was detected via ELISA. The percentage of signal in the apical vs. basolateral chamber was calculated and graphed. **p < 0.01 (Student's t test). (C) Light images taken at 100× magnification show the morphological differences between the cell lines. Bar, 200 μm. (D) Cells were grown on coverslips to confluency, allowed to polarize for 5 d, and fixed and stained with an anti-Scribble primary antibody, followed by an Alexa 488–labeled secondary antibody (green). Nuclei were stained with DAPI (blue). Images were obtained at 400× magnification. Right, enlarged images. Bar, 200 μm.

