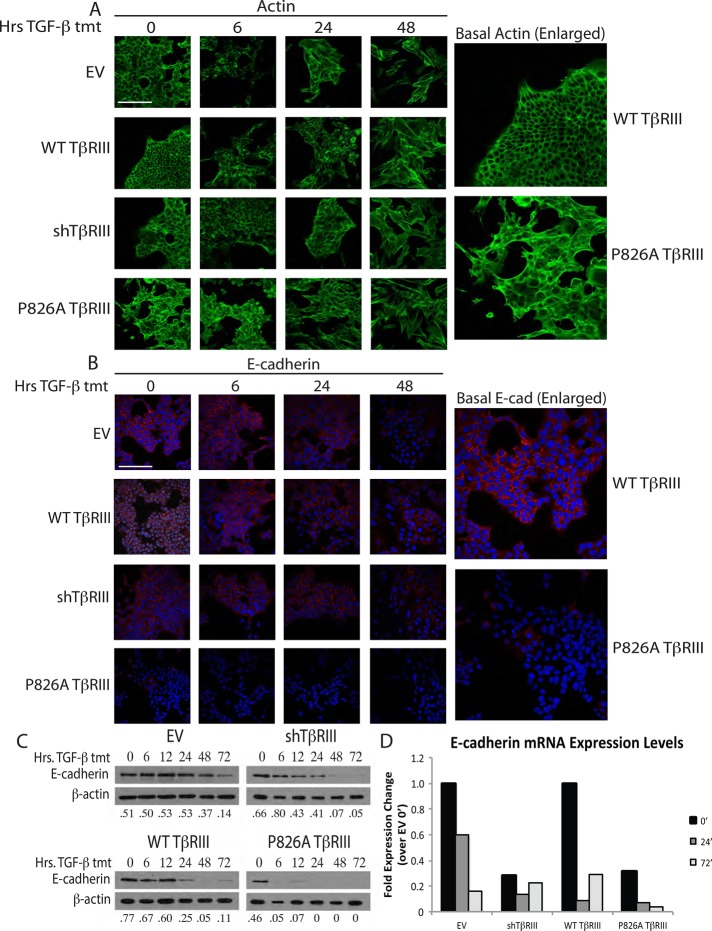
FIGURE 4.
P826A TβRIII cells have reduced epithelial marker expression. (A) Cells were grown on coverslips and treated with 100 pM TGF-β1 for 0, 6, 24, or 48 h. Cells were subsequently stained with Alexa 488–conjugated phalloidin for visualization of actin (green). Enlarged images show the basal difference between actin staining in the WT and P826A TβRIII cells. Bar, 200 μm. (B) Cells were grown and treated as in A and stained with a primary antibody against E-cadherin, followed by an Alexa 594–conjugated secondary antibody (red). Nuclei were stained with DAPI (blue). Enlarged images show the basal difference in E-cadherin staining between WT and P826A TβRIII cells. All images were taken at 400× magnification. Bar, 200 μm. (C) Cells were grown in six-well dishes and treated with 100 pM TGF-β1 for 0, 6, 12, 24, 48, or 72 h. Cell lysates were analyzed by Western blotting for the epithelial marker E-cadherin. β-Actin was used as a loading control. The ratios of E-cadherin to actin are noted beneath each lane. (D) Cells were grown in six-well format and treated with 100 pM TGF-β1 for 0, 24, and 72 h. To analyze the differences in E-cadherin mRNA levels, total RNA was harvested, and qPCR for E-cadherin was performed. A representative graph shows the fold expression change for each cell line and time of treatment in comparison to the EV 0-h time point. Data were normalized to GAPDH expression. The experiment was repeated three times.

