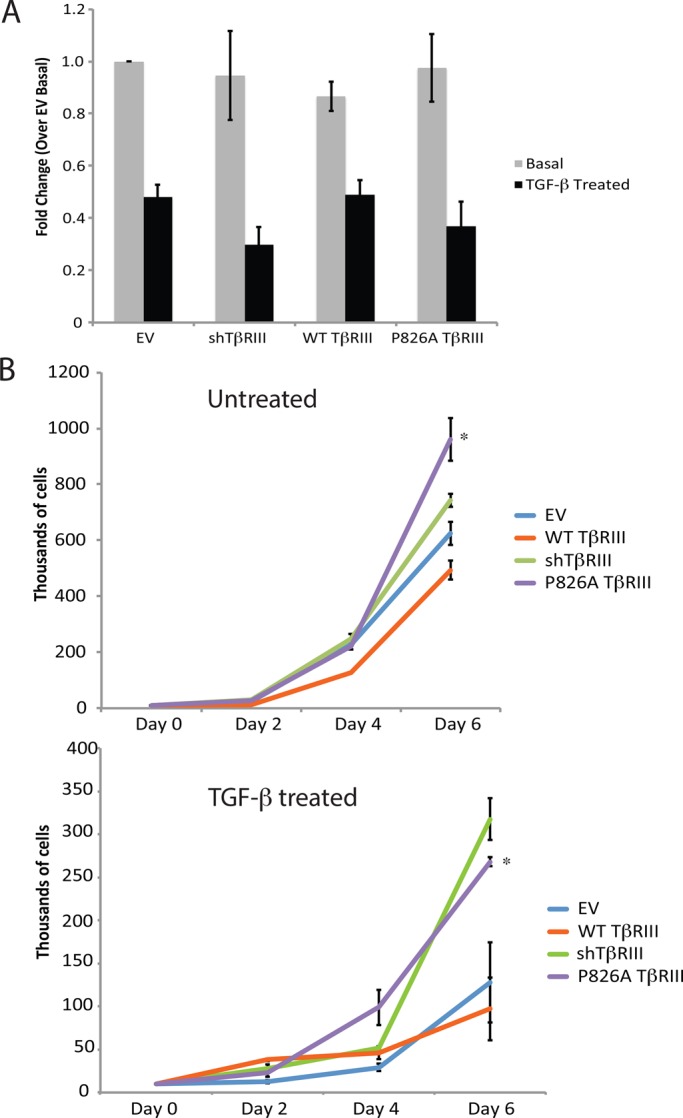
FIGURE 6.

P826A TβRIII cells exhibit an enhanced rate of proliferation. (A) We plated 1 × 10⁴ cells in triplicate in 96-well format and grew them for 24 h in the absence or presence of 100 pM TGF-β1. Cells were then labeled with 1 μCi of 3H for 4 h, and the level of incorporation was measured by scintillation counting. The graph depicts the fold change for each cell line over the untreated EV cells. Data were analyzed using Student's t test. No significant differences were found within each group (treated or untreated). The experiment was repeated three times. (B) We plated 1 × 10⁴ cells in a six-well dish. Cells were grown in the presence (top) or absence (bottom) of 50 pM TGF-β1, with fresh media and TGF-β1 added every other day. Cells were trypsinized and counted 2, 4, and 6 d after plating, using a hemocytometer. Dead cells were excluded via staining with trypan blue. The graphs show the number of cells counted for each day (thousands) on the y-axis. Each cell line was plated in duplicate, and the experiments were performed three separate times. *p < 0.05 for P826A TβRIII compared with WT TβRIII cells at day 6 (Student's t test).
