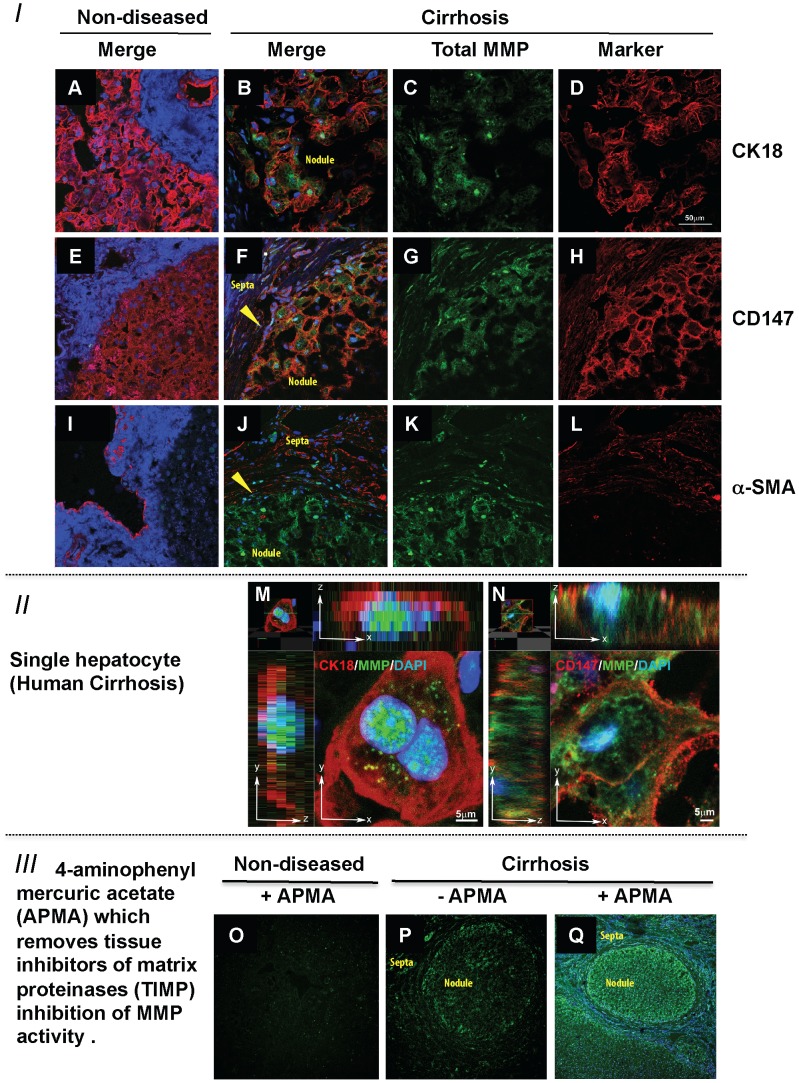
Figure 2. In-Situ Zymography of Matrix Metalloproteinase Activity and its Cellular Localisation in Liver Tissue.
Co-localisation in human liver of MMP activity (green) with hepatocyte marker CK18 (red - Panels A, B, D and M) and CD147 (red - Panels E, F, H and N), nuclei are stained with Dapi (blue). MMP activity (green) can be seen within the cells (Panels B, F, M and N). Confocal microscopy shows an absence of MMP activity (green) in non-diseased tissue (Panels A, E and I) but abundant hepatocyte MMP activity in CK18 positive hepatocytes (Panels B and M), these binuclear cells also express CD147 (Panels F and N). Importantly, α-SMA (red) an activated HSC-marker is not expressed in non-diseased liver HSCs (Panel I) but is expressed in cirrhosis (Panels J and L). α-SMA (red) does not co-localise with MMP activity in green (Panel J). The effect of addition of aminophenylmercuric acetate (APMA) is shown in the third group of confocal panels (Panels O–Q). There is no TIMP regulated MMP activity in non-diseased liver (Panel O). In cirrhosis, basal MMP activity (Panel P) is increased markedly with APMA addition (Panel Q compared to P). In panels B, F, J, P and Q the hepatic nodule and fibrotic septa have been labelled. In addition the arrowheads in panels F and J highlight the boundary between the nodule and septa. Magnification for panels A-L is 63× and for panels is O-Q 10×.

