
Fig. 4.
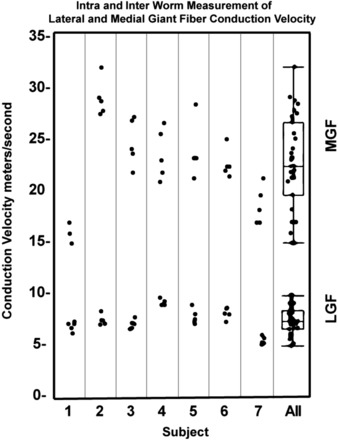
Intra- and interworm measurements of LGF and MGF conduction velocities. The two right box plots show the variance of the data for all seven worms. A paired t-test with an α-level of 0.05 gave P < 0.0001 between the LGF and MFG conduction velocities.