
Fig. 4.
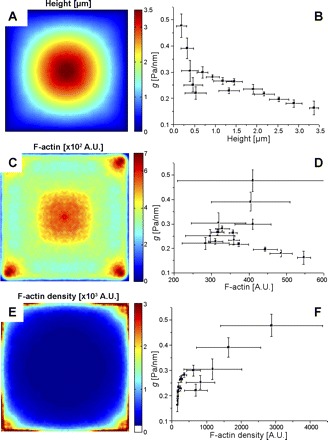
A: average height of cell measured with atomic force microscopy (AFM) (n = 5). B: cross plot of local stiffness g vs. local cell height. C: mean fluorescent intensity of F-actin in a square cell (n = 36). A.U., arbitrary units. D: cross plot of g vs. local F-actin amount. E: distribution of the local F-actin density calculated by dividing F-actin amount by cell height. F: cross plot of g vs. local F-actin density.