Fig. 3.

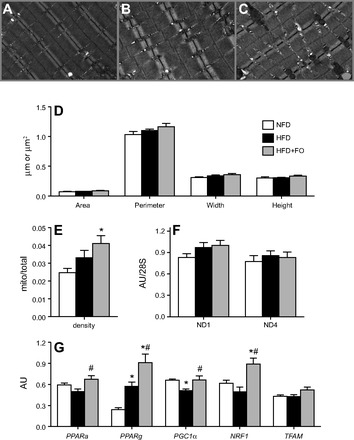
Mitochondrial abundance is increased with fish oil by electron microscopy with no change in mitochondrial DNA copy number. A, B, C: representative transmission electron micrographs (×25,000 magnification) of skeletal muscle from NFD (A), HFD (B), and HFD+FO (C) mice. D: average perimeter, width, height, and area of mitochondria were measured from digitized image. E: mitochondrial density by area was determined from digitized electron micrographs. F: mitochondrial DNA abundance was measured by RT-PCR using mitochondrial-encoded NADH dehydrogenase subunits 1 (ND1) and 4 (ND4) expressed relative to 28S as a nuclear housekeeping gene. G: gene transcript levels of peroxisome proliferator-activated receptor-α (PPARα), PPARγ (PPARγ), PPARγ coactivator 1α (PGC1α), nuclear respiratory factor 1 (NRF1), and transcription factor A, mitochondria (TFAM) were measured in muscle tissue at 10 wk. Bars represent means ± SE for NFD, HFD, and HFD+FO. *Significant statistical differences from NFD; #significantly different from HFD (P < 0.05, Tukey's HSD).
