
Fig. 5.
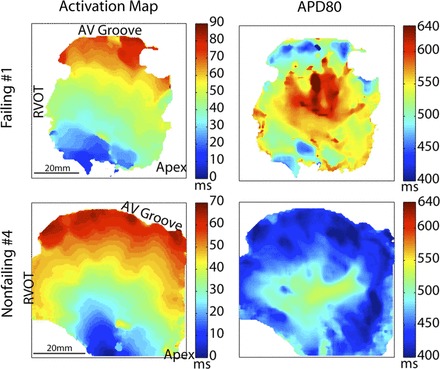
Representative examples of dispersion of repolarization at the endocardium of RV free wall from a failing heart (row on top) and a nonfailing heart (row on bottom) at the pacing CL of 2,000 ms. Left, maps of activation (from blue to red) after a stimulus at the bottom of the FOV. Middle, maps of APD80. Right, FOV with inverted color for better visualization of the structure.