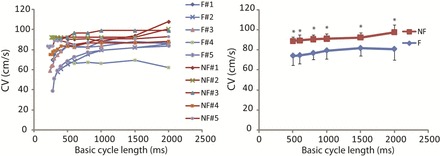
Fig. 6.

Conduction velocity (CV) restitution. Left, individual CV restitution from failing (blue lines) and nonfailing (red lines) human hearts. Right, averaged CV restitution. *P < 0.05 between failing and nonfailing group. Note that the CV was significantly decreased in the failing hearts. Also note that CV restitutions in failing hearts 2 and 5 have a nonflat slope over a much wider range of BCL.
