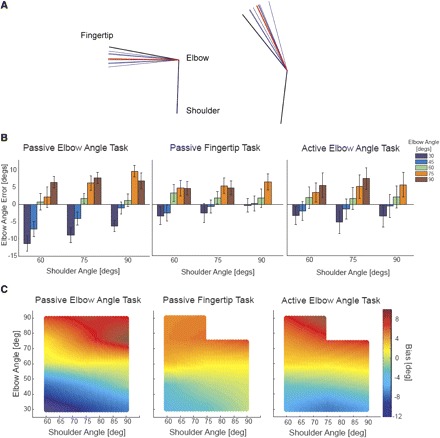
Fig. 4.

Accuracy across joint space. A: raw traces from a subject in Task 1. Black lines represent average actual arm position (for the particular configuration), blue lines represent perceived positions on individual trials, and red lines represent average perceived position. When the elbow was flexed (left), the subject perceived the angle as even more flexed, and when the elbow was extended (right), the subject perceived the angle as even more extended. B: the bar graphs show group errors for each arm configuration tested, for each task (error bars represent SEs). Consistent across shoulder angles, elbow angle estimates were overextended as the elbow became more extended and overflexed as the elbow became more flexed. This pattern was consistent across the 3 tasks. C: the heat plots show average group errors across joint space interpolated from the tested configurations. Hotter colors represent flexion errors and colder colors represent extension errors. Elbow estimate biases are dependent on elbow angle (i.e., colors change along the y-axis) but not shoulder angle or task.
