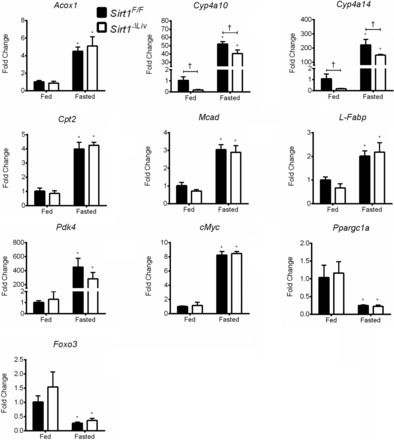
Fig. 10.

Expression of PPARα target genes after fasting. Sirt1F/F and Sirt1ΔLiv mice were fasted for 24 h. RT-qPCR analysis was performed on liver samples, and values were normalized to β-actin and expressed as fold change from Sirt1F/F mice. Significant differences between control and WY treatment are indicated (*P < 0.05). Significant differences between Sirt1F/F and Sirt1ΔLiv mice are indicated (†P < 0.05).
