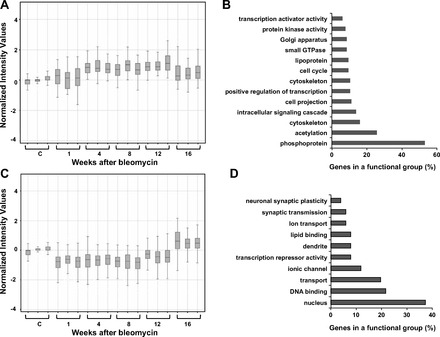
Fig. 4.

Gene expression patterns of genes in clusters 3 and 4 and enrichment of genes in each cluster with functional categories. Time-course profiles of cluster 3 (A) and cluster 4 (C) and enrichment of functional annotations in cluster 3 (B) and cluster 4 (D) are shown. Genes contained within each cluster are listed in Supplementary Tables S3 and 4, respectively.
