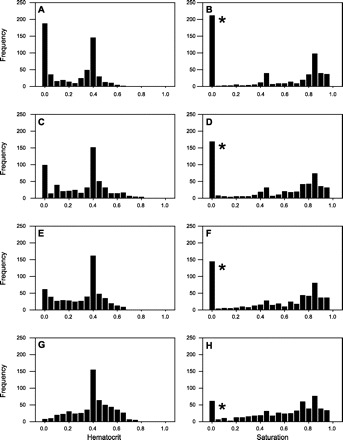
Fig. 4.

Effects of metabolic flow regulation mechanisms on hematocrit (left) and saturation (right) distributions for all vessels in the network. A and B: no metabolic regulation. C and D: erythrocyte-derived signal, Crbcmeta = 10. E and F: wall-derived signal, Cwallmeta = 20. G and H: reference (physiological) state. *Vessels with zero hematocrit are assumed to have zero saturation.
