
Figure 1. The transcriptional response induced by dengue infection is correlated with viral load.
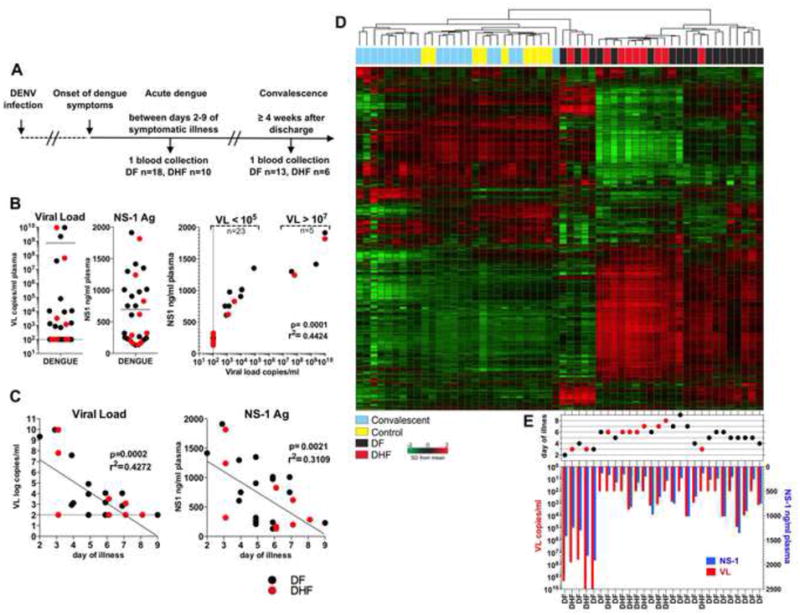
(A) Clinical study design. (B) VL and NS-1 antigen concentration in plasma from acute dengue patients. Correlation analysis shows formation of two distinct groups with high (VL>107, n=23) and low (VL<105, n=5) viral burden. (C) Correlation analysis of VL (left) and NS-1 Ag concentration (right) with days of dengue illness at the specimen collection. (D) Unsupervised clustering analysis. (E) Reported days of illness at collection and matching VL (red bars) and NS-1 Ag (blue bars) corresponding to the individual dengue patients on the heat map. DF n=18: black dots, DHF n=10: red dots. See also Figures S1 and Table S1 and S2.