
Figure 7. DENV infection in rhesus macaques stimulates enhanced numbers of the CD14+CD16+ monocytes into LN.
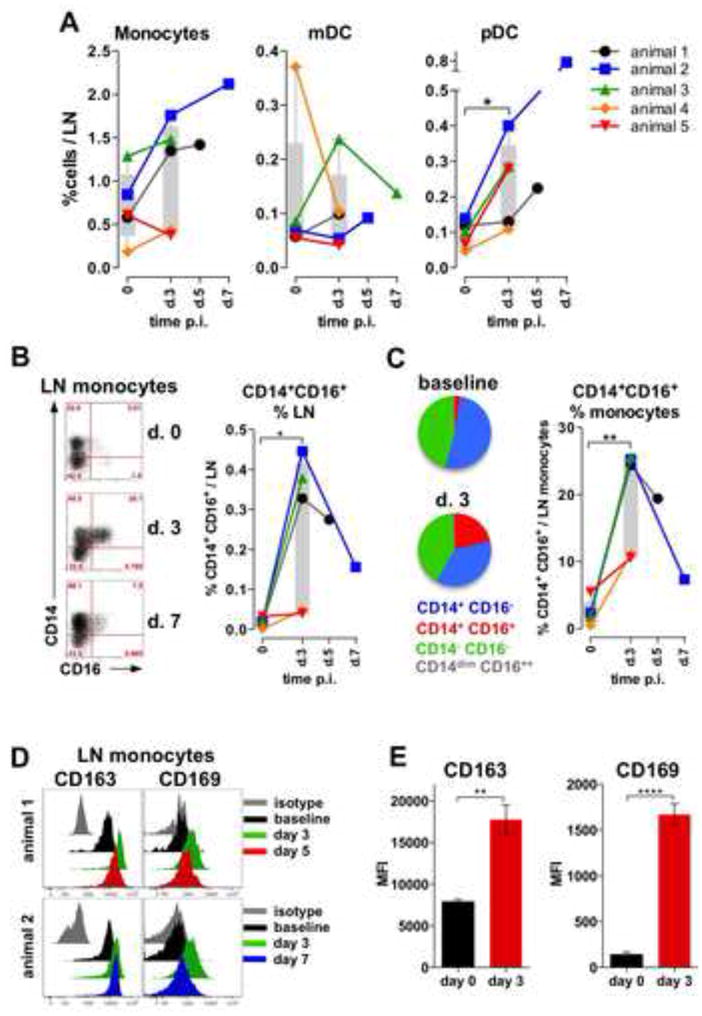
(A) Proportions of innate cells in LNs. (B) Dot plot representation of CD14 and CD16 expression in monocyte subsets in LN. Graph represents frequency of CD14+CD16+ monocytes within all cells in LN. (C) Pie charts show mean proportions of the CD14+CD16- (blue), CD14+CD16+ (red), CD14-CD16- (green) and CD14dimCD16++ (gray) cells within the total monocytes at baseline and day 3, n=5. Graph indicates proportion of CD14+CD16+ cells within all monocytes in LN. (A-C) Symbols represent individual animals in the cohort. (D) Histograms: monocytes expression of CD163 (left) and CD169 (right) at baseline (black), d 3 (green), d 5 (red, animal 1), 7 (blue, animal 2) and isotype (gray) in 2 representative animals. (E) Mean Fluorescent Intensity of expression of CD163 (left) and CD169 (right) at baseline (black) and d 3 (red) post infection, mean +/- SEM (n=5), t-test.