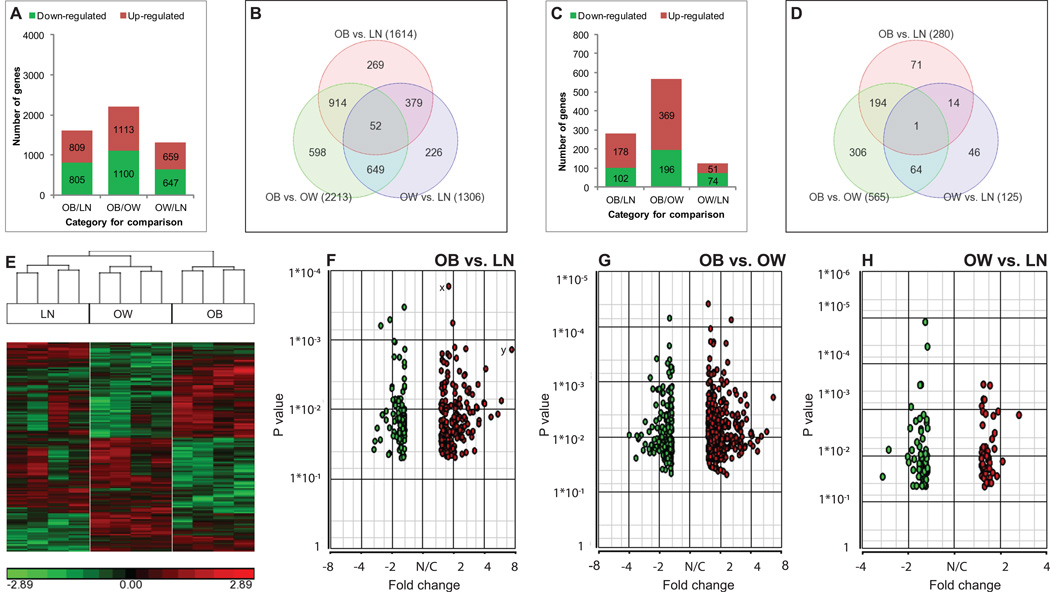
Fig. 1. Pictorial representation of microarray data.
Transcriptome analysis of human injured meniscus from lean (LN, BMI 18.5–24.9 kg/m2), overweight (OW, BMI 25–29.9 kg/m2) and obese (OB, BMI ≥30 kg/m2) patients was performed. The numbers of up-regulated and down-regulated genes in the three comparisons (OB/LN, OB/OW, and OW/LN) without (A) or with (C) restriction of fold-change are shown. Venn diagrams representing the number of differentially expressed genes in each comparison and the overlaps between the three comparisons are shown for any fold-change (B) or at a fold-change set at ≥1.5 only (D), with the numbers of differentially expressed genes shown in parenthesis for all three comparisons. The numbers shown in overlapping areas depict the number of genes common to two or more comparisons. Hierarchical clustering representing the transcripts that were significantly (P<0.05) and differentially regulated by BMI is shown (E). Each vertical row represents a sample and each horizontal line represents a single gene. Down-regulated genes are shown in green while up-regulated genes are shown in red. The volcano plots of differentially expressed genes (P<0.05) for the three comparisons are also shown (F–H). The X-axis represents the fold-change and Y-axis represents the P value of the ANOVA analysis. Using a stringent criterion (P<0.05, fold-change ≥1.5-fold), there were 257, 118 and 508(after removing duplicate and non-annotated genes) for OB/LN, OW/LN and OB/OW categories respectively were selected. Gene x has the lowest P value in this category and therefore is statistically the most significant, while gene y is around 8-fold up-regulated depicting its biological significance. Green circles represent down-regulated genes whereas red circles denote up-regulated genes. N/C = no change

