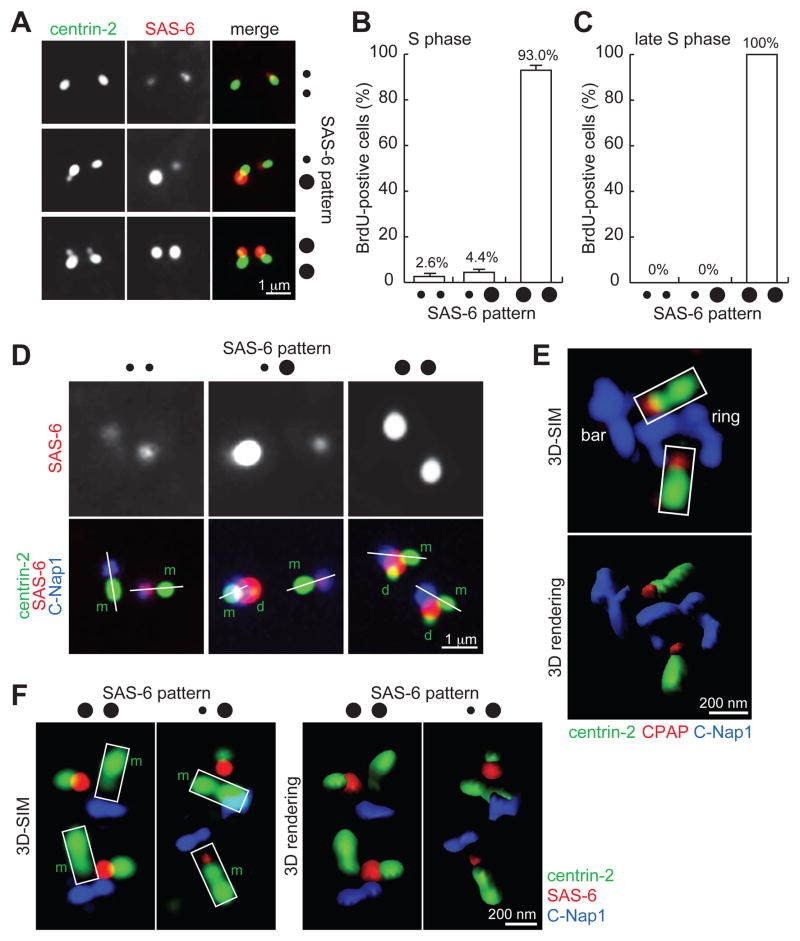
Figure 1. SAS-6 is transiently recruited to the proximal lumen of mother centrioles in early S-phase.
(A) U2OS cells in S phase were processed for immunofluorescence to visualize centriole (centrin-2) and SAS-6.
(B) Quantification of cells with weak SAS-6 foci in S phase. Error bars, standard deviation. n>80, N=3.
(C) Quantification of weak SAS-6 foci in late S phase. n>100, N=3.
(D) Weak SAS-6 localizes to the proximal end of mother centrioles. Linear alignment of centrin-2 (distal-end component) and C-Nap1 (proximal end) is marked by a white line. Here, rabbit antibodies recognizing the C-terminus of C-Nap1 were used with a mouse anti-SAS-6 antibody. m, mother; d, daughter.
(E) 3D-SIM image of luminal components CPAP and centrin-2 in comparison to non-luminal component C-Nap1. Here, a mouse antibody recognizing the N-terminus of C-Nap1 was used with a rabbit anti-CPAP antibody. Imaris 3D rendering is presented as indicated.
(F) 3D-SIM images of SAS-6, C-Nap1, and centrin in S-phase centrioles stained with the antibodies indicated. m, mother.
All S-phase cells in (A), (B), (C), (D) and (F) were identified by BrdU labeling (see Experimental Procedures), not shown.

