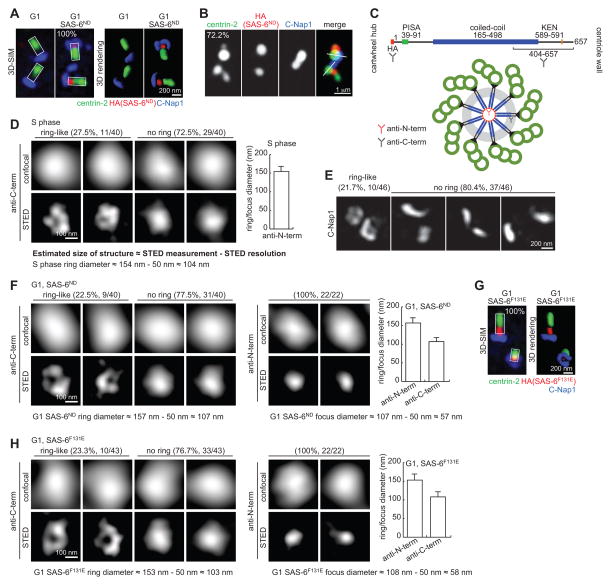
Figure 2. G1 centrioles can recruit and organize SAS-6 into an ordered structure similar to the cartwheel.
(A) RPE-1 cells arrested in G1 for 48 hours followed by expression of HA-tagged SAS-6ND were imaged by 3D-SIM. n>45, N=3.
(B) G1-arrested RPE-1 cells expressing SAS-6ND as described in (A) were released into S phase by serum reintroduction and stained with the indicated antibodies. S-phase cells were identified by BrdU labeling, not shown. n>21, N=3.
(C) Schematic diagram of domain organization of SAS-6 and the epitopes recognized by the antibodies used in STED analyses.
(D) Representative STED images of SAS-6 staining with anti-C-term antibody on normal S-phase centrioles were shown. Graph presents STED measurements of ring/focus diameter by averaging the long and short axes. Actual size of the structure is estimated by subtracting STED resolution from STED measurements as indicated. Error bar, standard deviation. n=40.
(E) Frequency of observing C-Nap1 ring under 3D-SIM. n=46.
(F) STED imaging of SAS-6ND stained with anti-C-term and anti-N-term antibodies. Actual size of the structure is estimated as indicated. Error bars, standard deviation. n as indicated.
(G) SAS-6F131E localizes to the proximal lumen of G1 centrioles. 3D-SIM image of G1-arrested RPE-1 cells inducibly expressing HA-tagged SAS-6F131E as described in (A). n>39, N=3.
(H) STED imaging of SAS-6F131E stained with anti-C-term and anti-N-term antibodies. Actual size of the structure is estimated as indicated. Error bars, standard deviation. n as indicated.

