
Fig. 1. Heat Map of miRNA microarray.
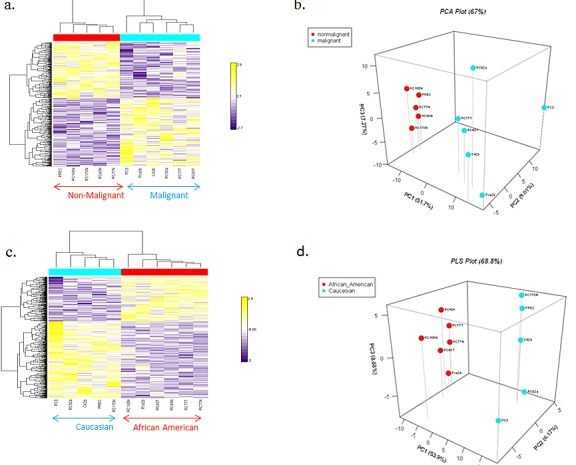
(a) Hierarchical clustering analyses of miRNAs (left) grouped by non-malignant and malignant status: non-malignant cell lines (red block), malignant cell lines (blue block). (b) PLS plot of AA and CA prostate cell lines grouped by malignancy. (c) Hierarchical clustering analyses of miRNAs (left) grouped by race. AA cell lines (red block), CA cell lines (blue block). miRNAs are ordered according to their cluster determined by p-values using the Kruskal-Walis test. (d) PLS plot of AA and CA prostate cell lines grouped by race.