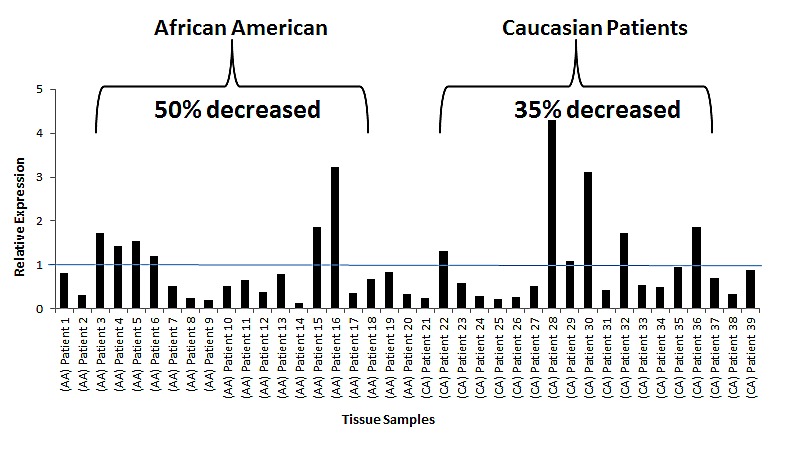
Fig 5. miR-152 expression in AA and CA matched normal tumor cohort.

(a) qRT-PCR of miR-152 expression in normal-tumor paired prostate tissue samples. All samples were normalized to the adjacent normal samples. All values under value one represent down-regulation of miR-152. (b) Plot demonstrating the individual miR-152 expression values in AA and CA patients: Note: 50% of the individual AA patients had significant lower miR-152 expression compared to only 35% of CA patients. p-values (Benjamini-Hochberg corrected for multiple tests).
