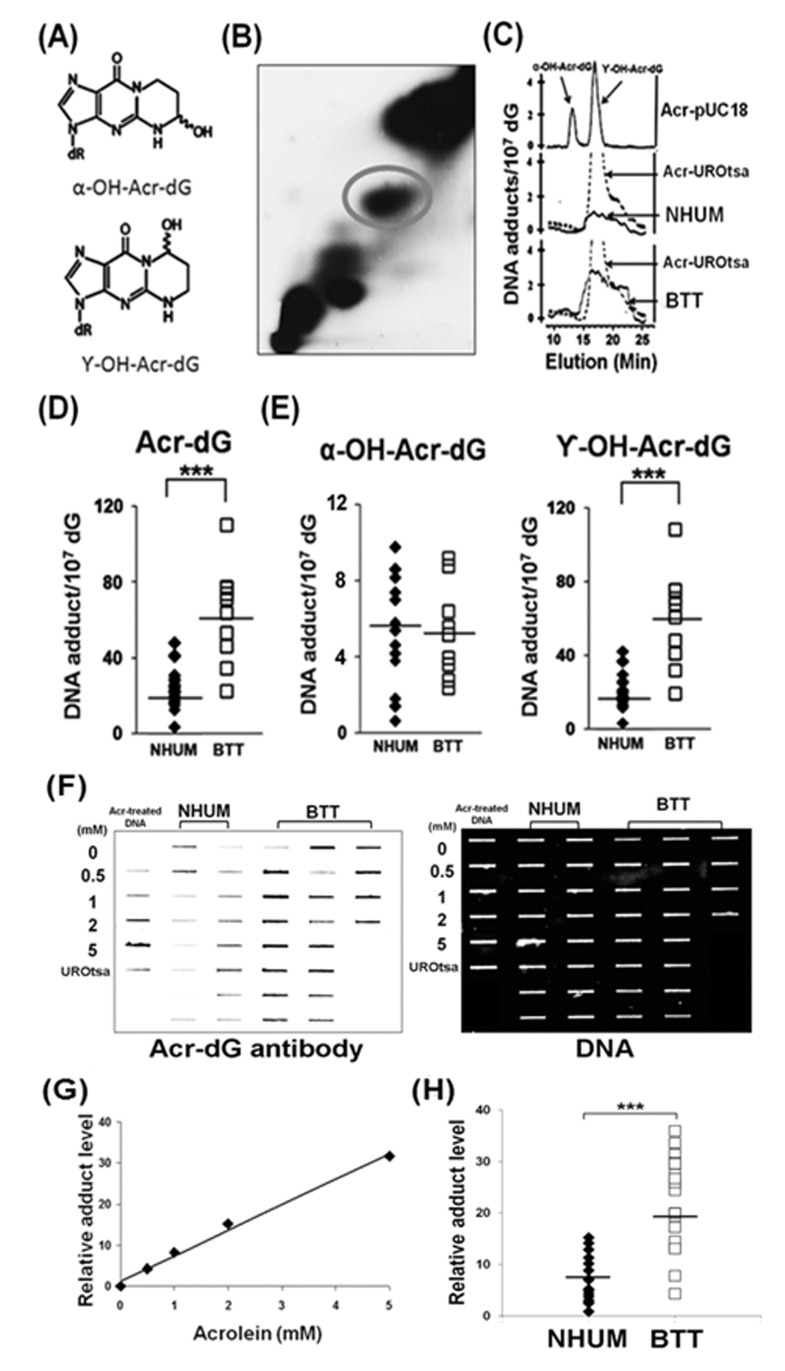
Figure 1. Acrolein (Acr)-dG DNA adduct analysis in normal human urothelial mucosa (NHUM) and bladder tumor tissue (BTT) samples.
(A) Chemical structures of α-OH-acrolein-dG and γ-OH-acrolein-dG. Genomic DNA from normal human urothelial mucosa and bladder tumor tissues were prepared and the acrolein-dG DNA adduct levels were determined by both a 32P-postlabeling two dimensional TLC/HPLC method (B to E) and by an immunochemical method (F to H) as described (13, 14). (B) A typical two dimensional TLC separation profile of isomeric acrolein-dG DNA adducts formed in normal human urothelial mucosa. The acrolein-dG DNA adducts spots (circled) resolved by two dimensional TLC (B) were extracted and further separated by HPLC (C). Similar results were observed for bladder tumor tissues. (C) The HPLC profiles of DNA adducts from acrolein-modified plasmid pUC18, acrolein-treated UROtsa cells, normal human urothelial mucosa, and bladder tumor tissues were compared. (D & E) Levels of total acrolein-dG (α-OH-acrolein-dG and γ-OH-acrolein-dG adducts) in normal human urothelial mucosa [mean ± s.d. = (25±10) X10−7/dG, n=19] and in bladder tumor tissues [mean ± s.d. = (63 ± 25) × 10−7/dG, n=10. Bars represent the mean value; statistical significance was analyzed with Student T-test. *** represents p value < 0.001. Genomic DNA from normal human urothelial mucosa (NHUM) (NB-2, NB-17 to NB-74, n=16) and bladder tumor tissue (BTT) (BT-1 to BT-75, n=20) used for acrolein-dG DNA adduct analysis by the 32P-postlabeling and two dimensional TLC/HPLC method were used for acrolein-dG DNA adduct detection by an acrolein-dG primary antibody and a quantum dot labeled second antibody in a slot blot apparatus as described [14]. (F) A typical slot blot result is shown. DNA was spotted on the membrane, hybridized with the acrolein-dG antibody, and then the quantum dot conjugated second antibody: first lane, plasmid pUC18 DNA modified with different concentrations of acrolein and DNA isolated from cultured UROtsa cells; second and third lanes, DNA from normal human urothelial mucosa samples; fourth, fifth and sixth lanes, DNA from bladder tumor tissue samples. Left panel, fluorescent development; right panel, the same amounts of DNA loaded in the membrane were stained with methylene blue. (G) Standard calibration curve as determined by fluorescence intensity of relative acrolein-dG DNA adduct level in plasmid pUC18 DNA modified with different concentrations of acrolein. (H) Relative acrolein-dG DNA adduct levels in normal human urothelial mucosa (n=16) and bladder tumor tissue (n=20) samples as detected by the immunochemical method as described above. Note: acrolein-dG DNA adduct levels in 10 BTT samples (BT-1 to BT-33) were detected by both 32P-postlabeling and the immunochemical methods. Because of the low amount of sample, 10 BTT samples (BT-54 to BT-75) were detected by immunochemical method only.

